Pitch density
Description
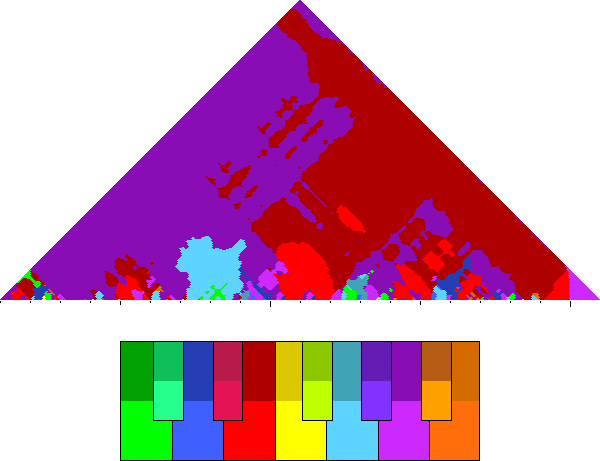
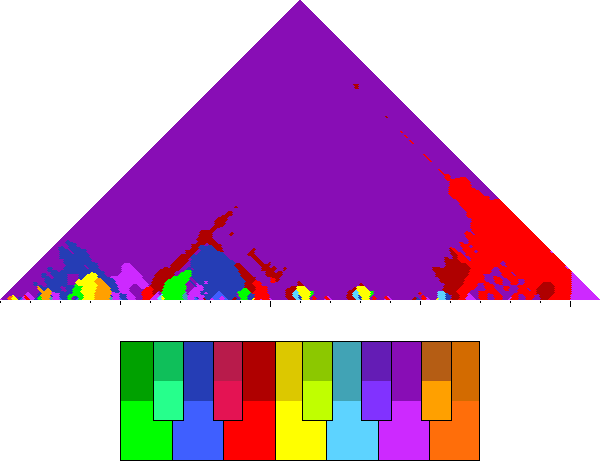
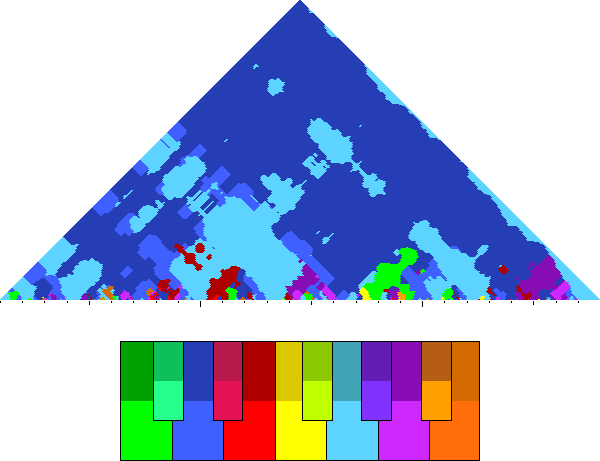
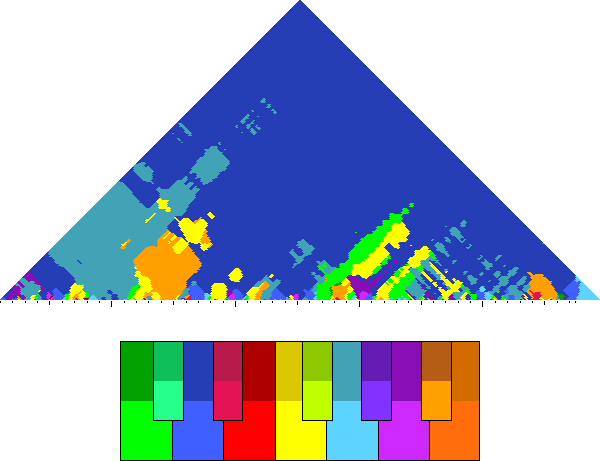
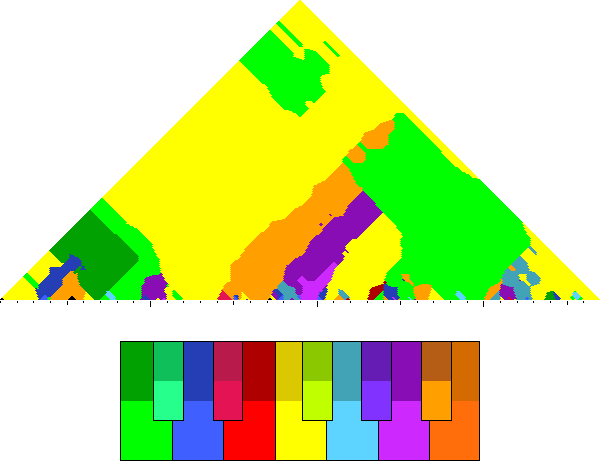
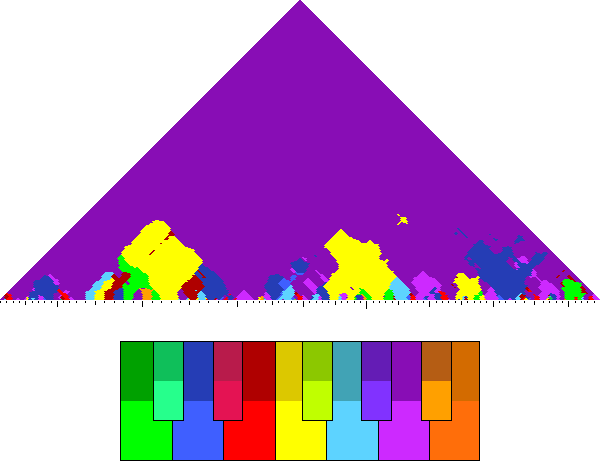
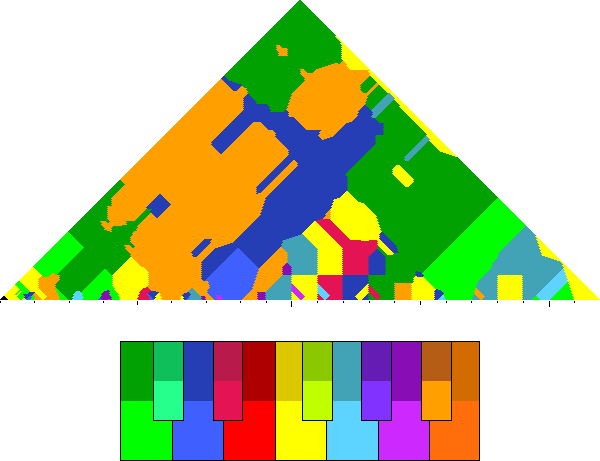
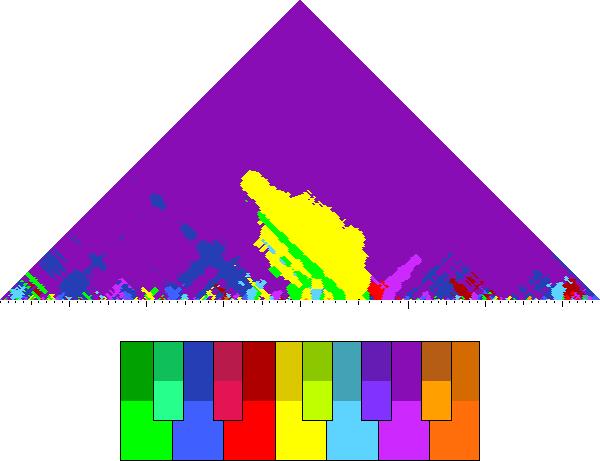
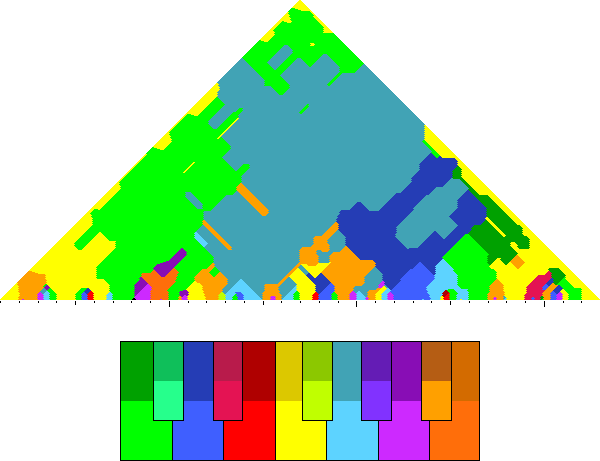
Three plots are shown for each musical work. The first two plots
measure the amount of pitch classes for the entire work: the plot on
the left measures pitches by duration, and the one on the right
counts pitches by note attacks. Every voice is given a different
color so that you can see the contribution of that voice to the the
total for each pitch class. The final note (or final chord root)
is labeled on each plot.
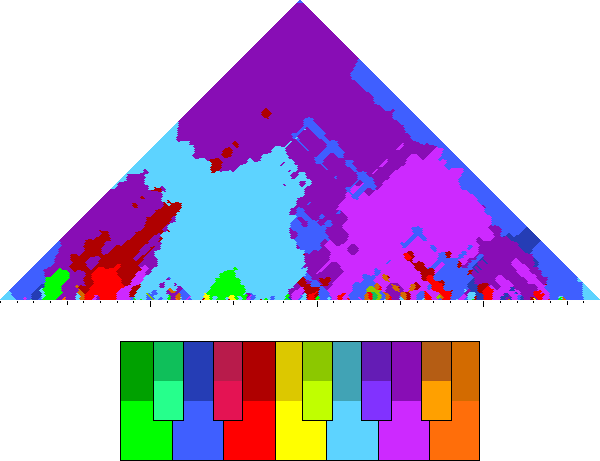
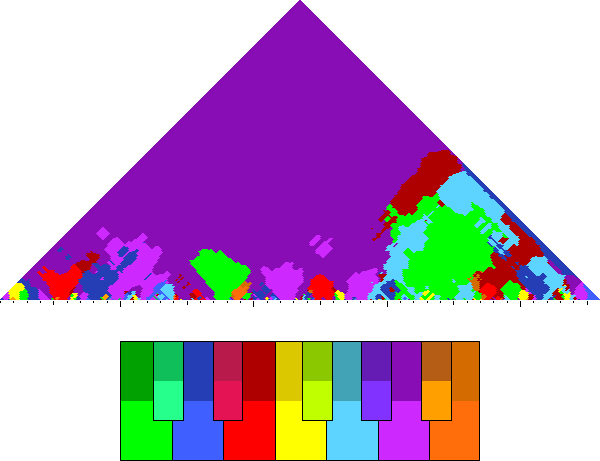
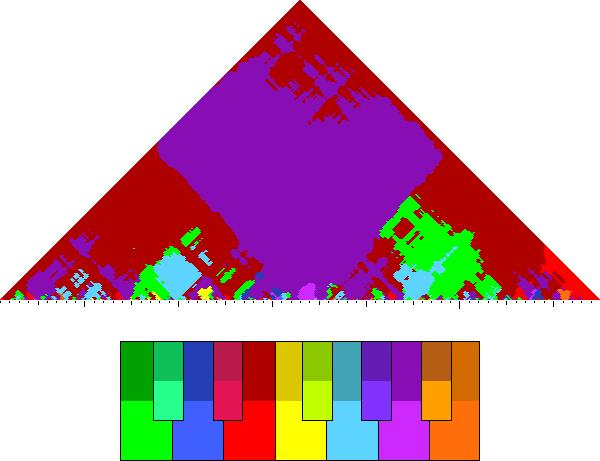
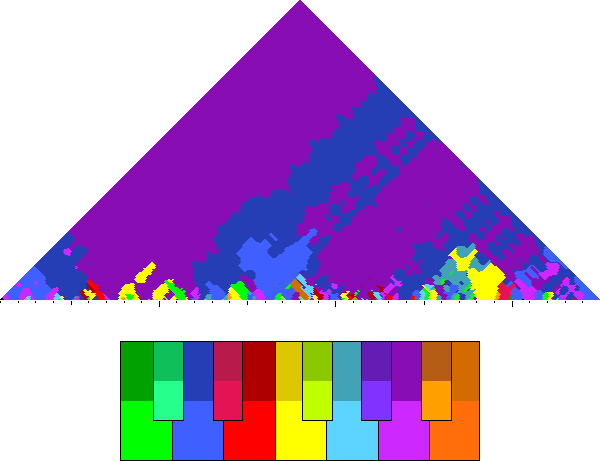
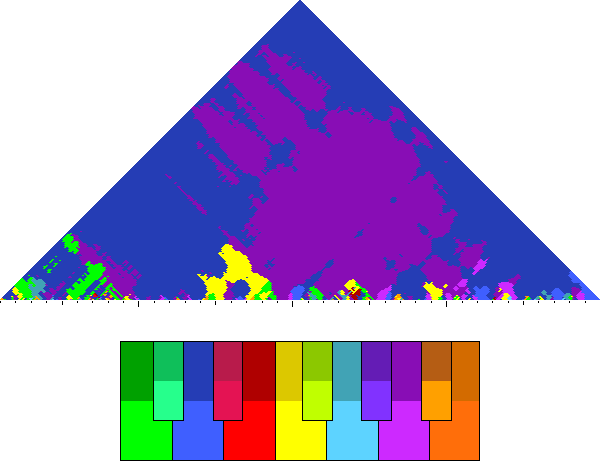
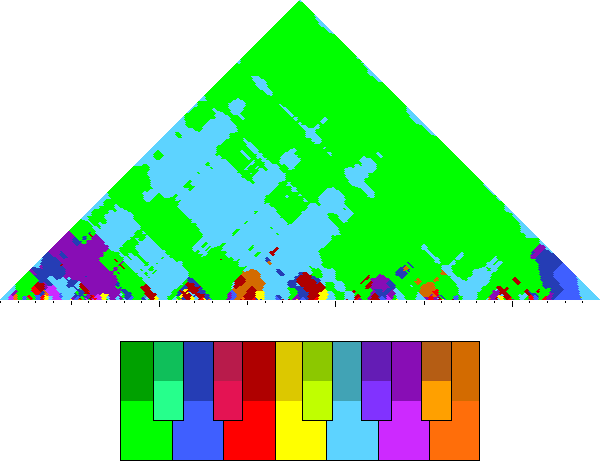
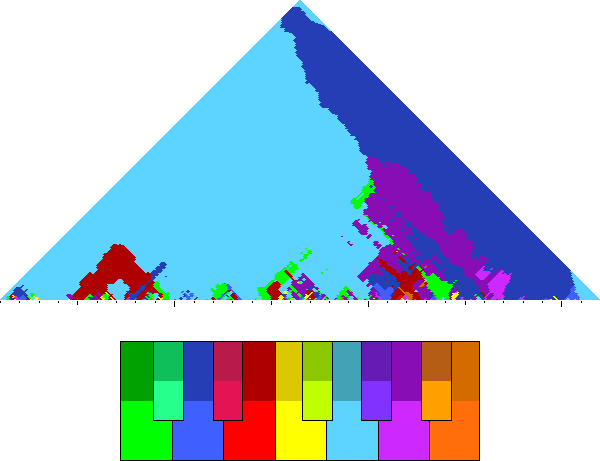
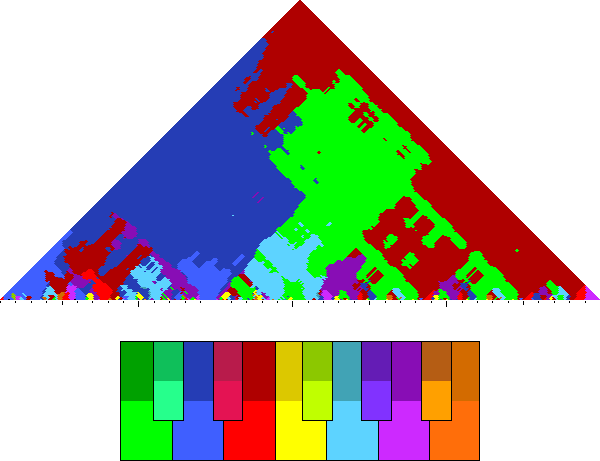
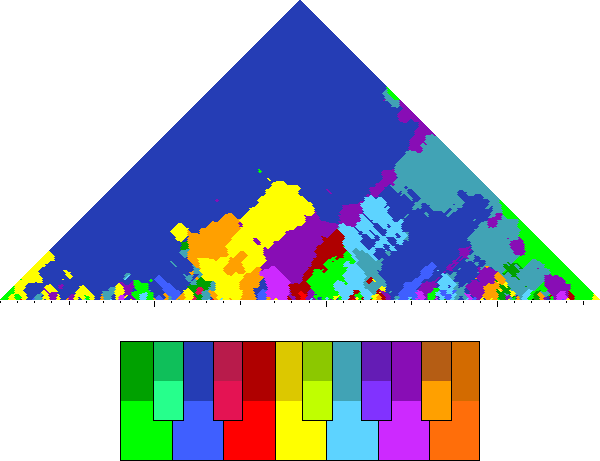
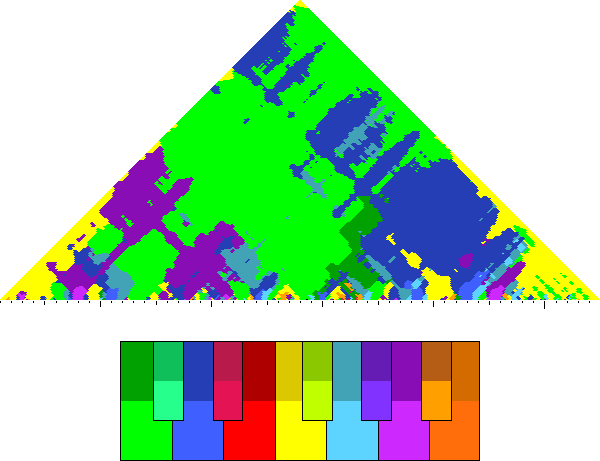
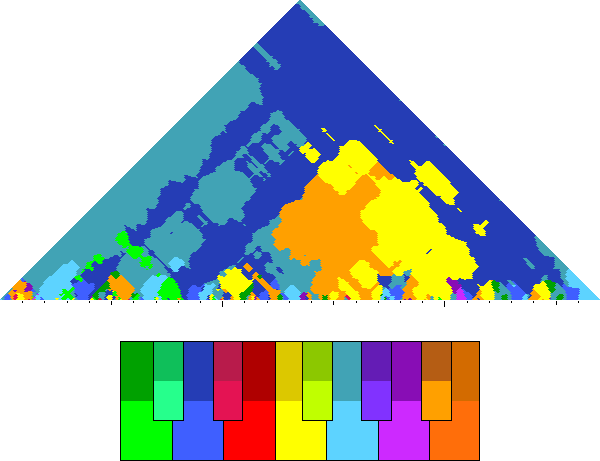
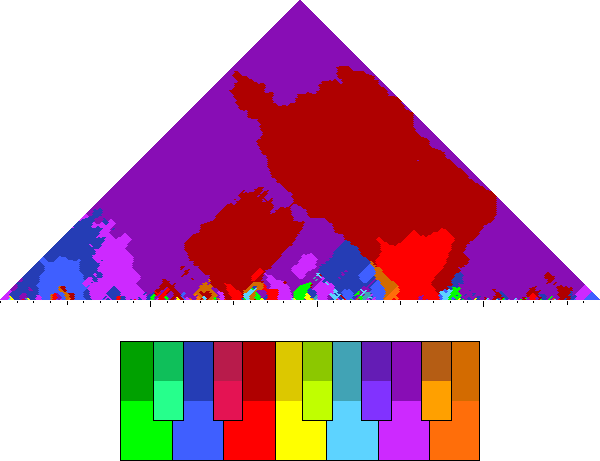
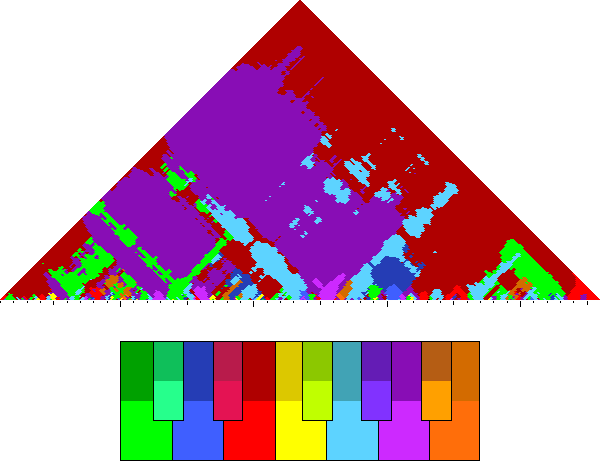
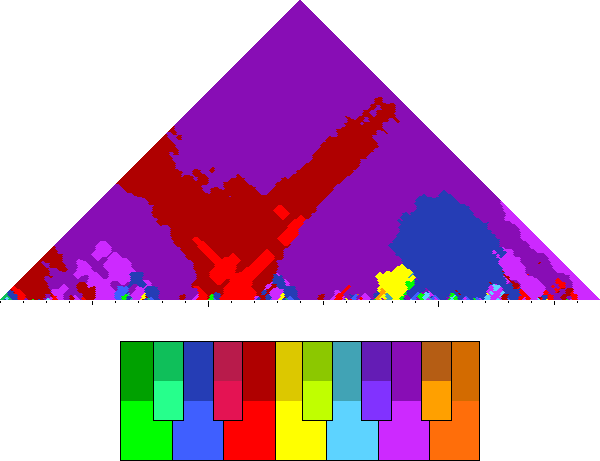
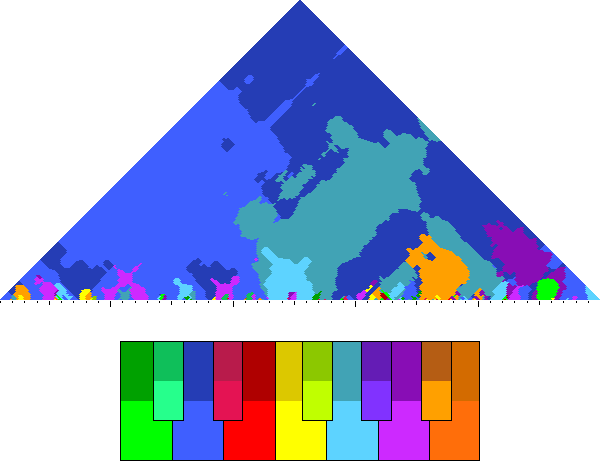
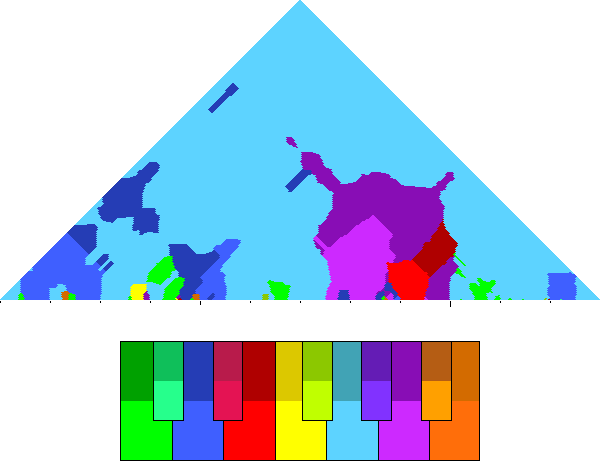
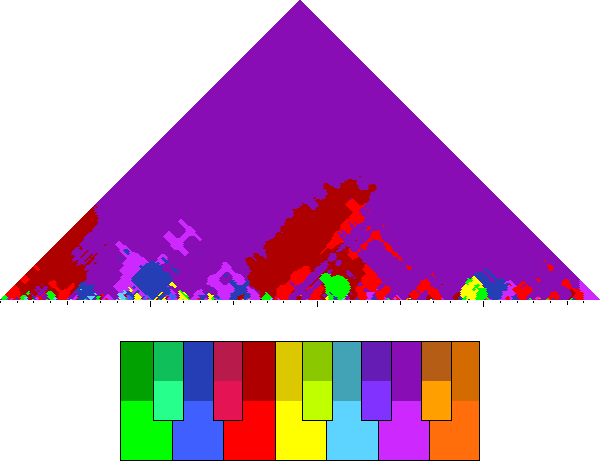
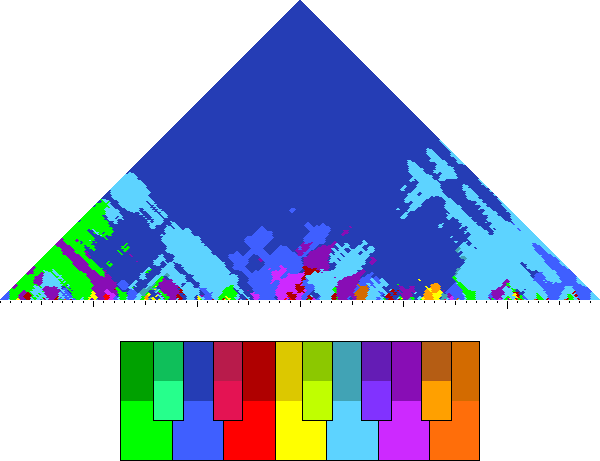
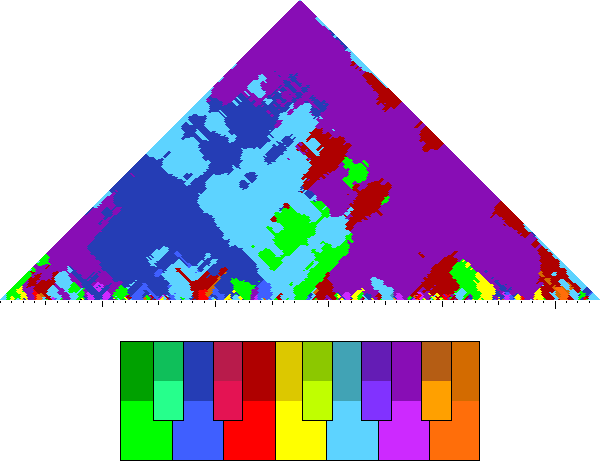
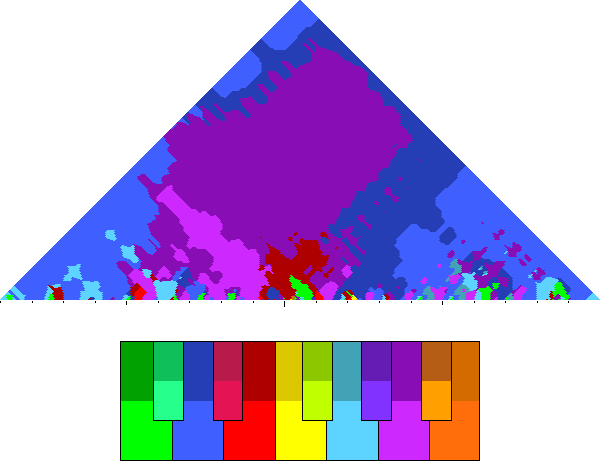
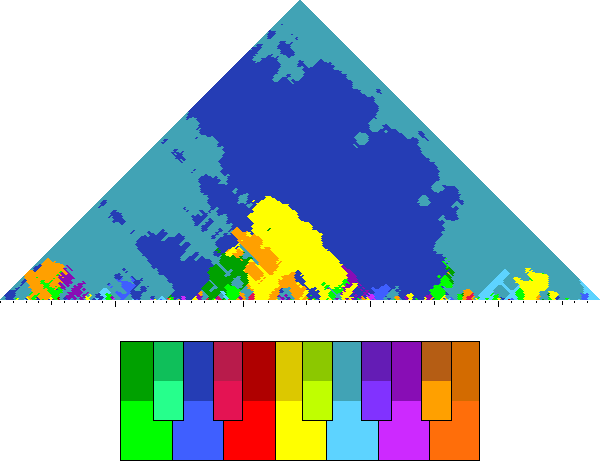
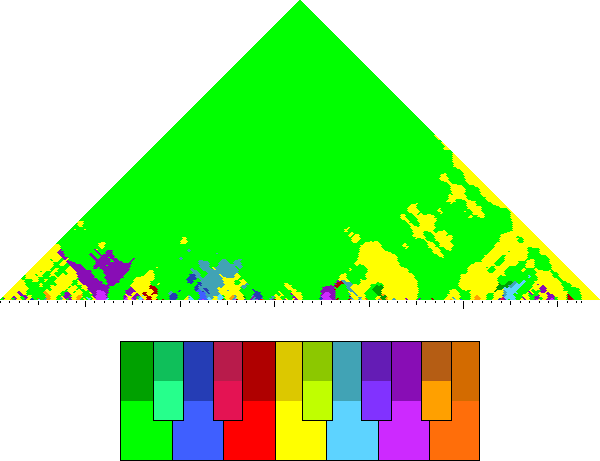
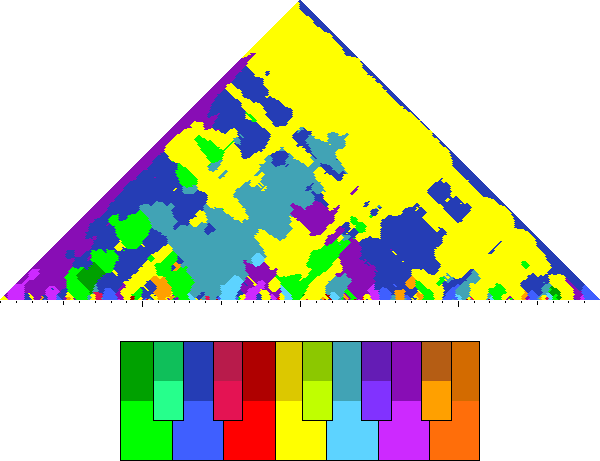
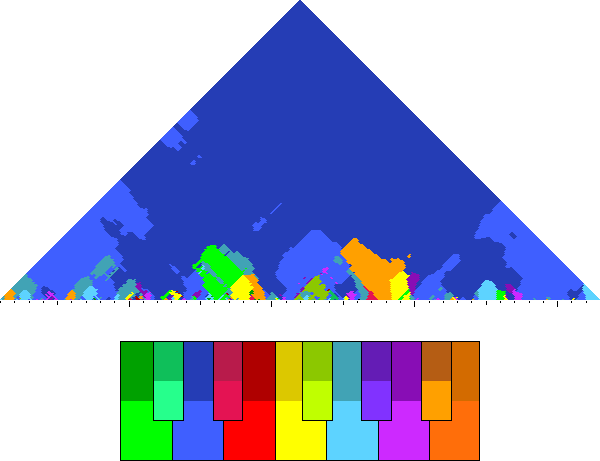
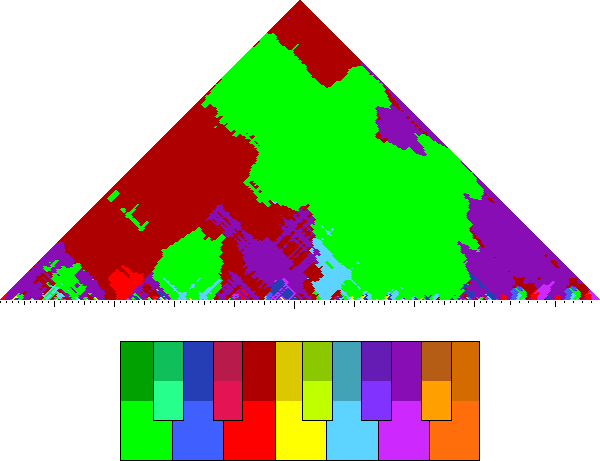
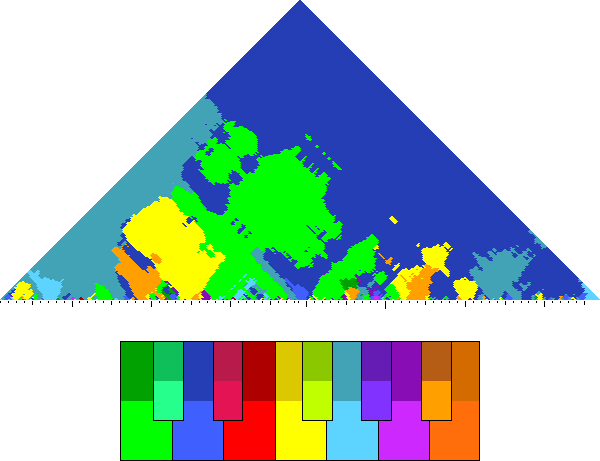
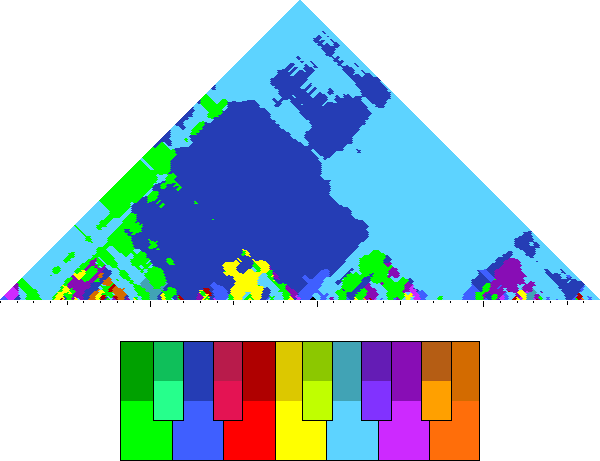
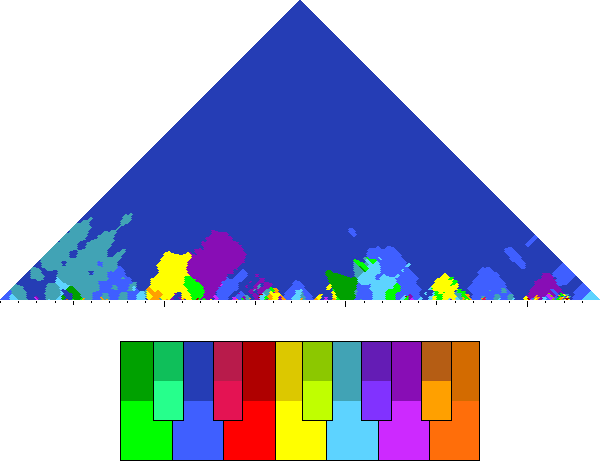
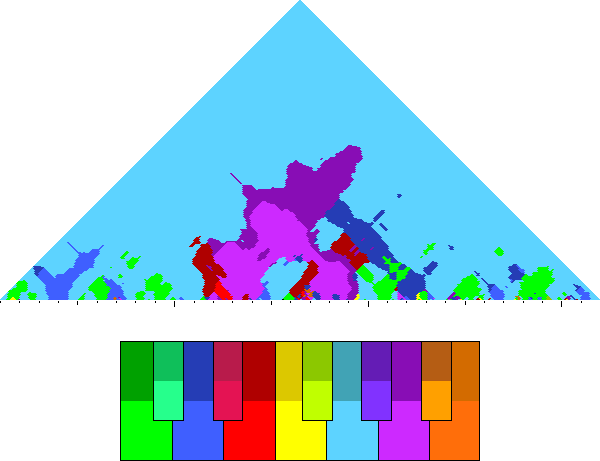
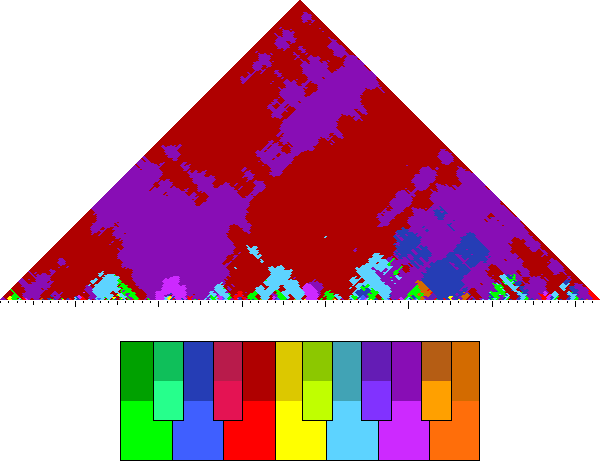
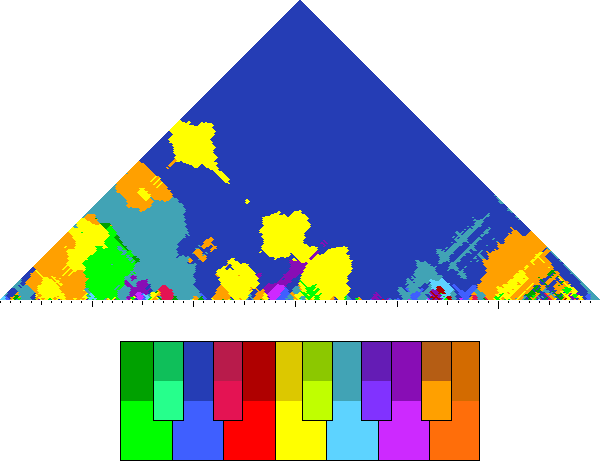
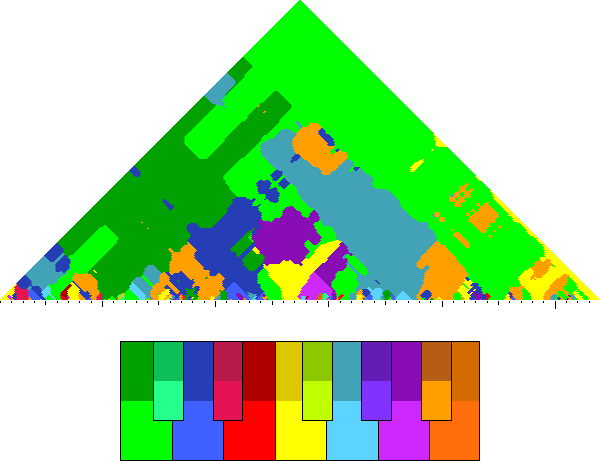
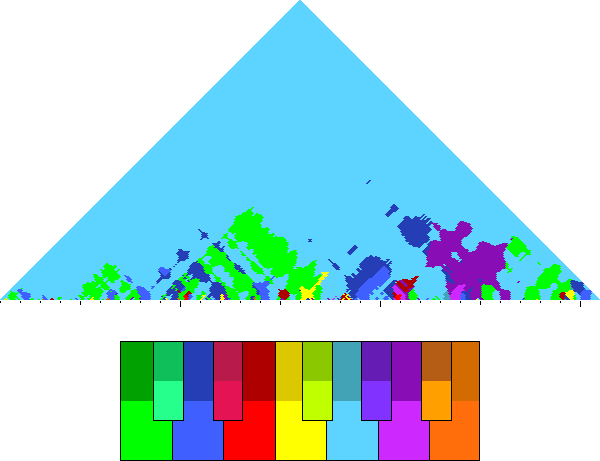
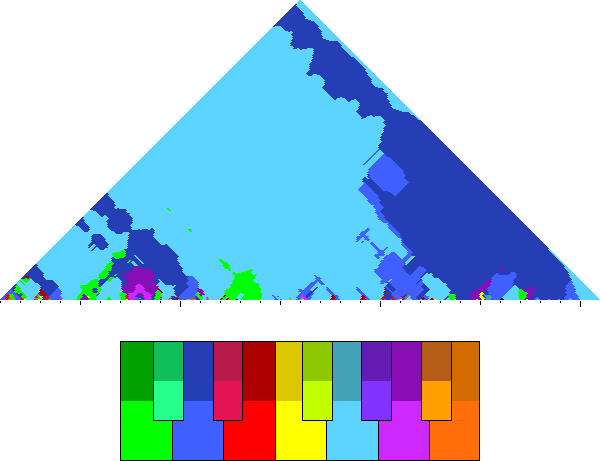
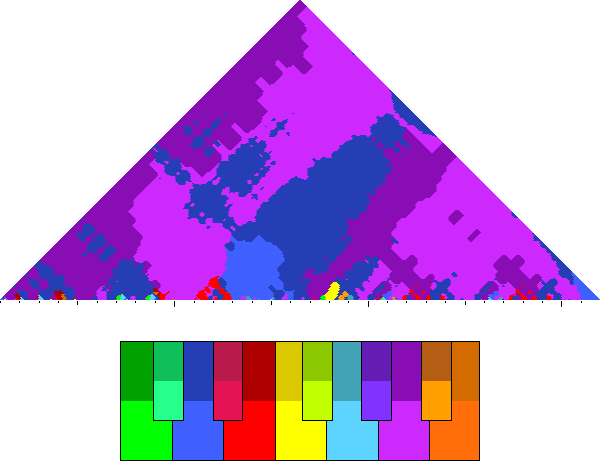
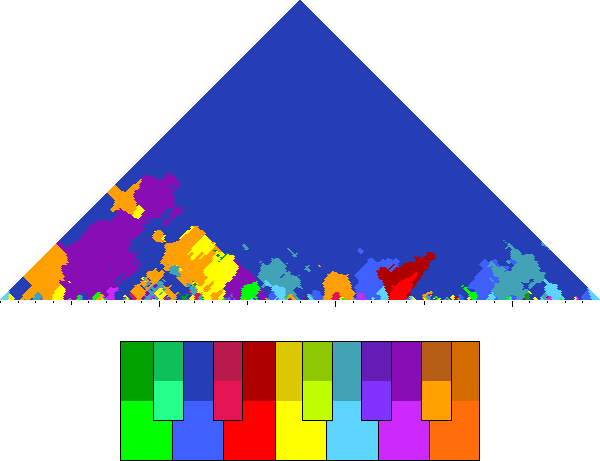
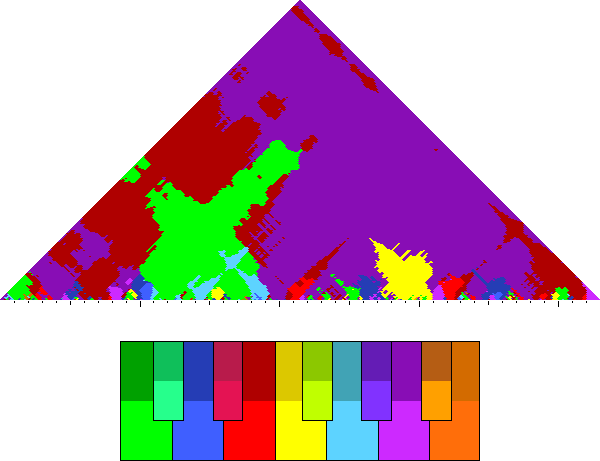
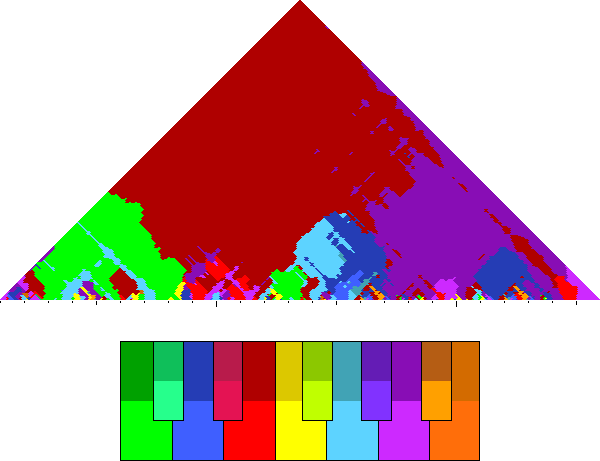
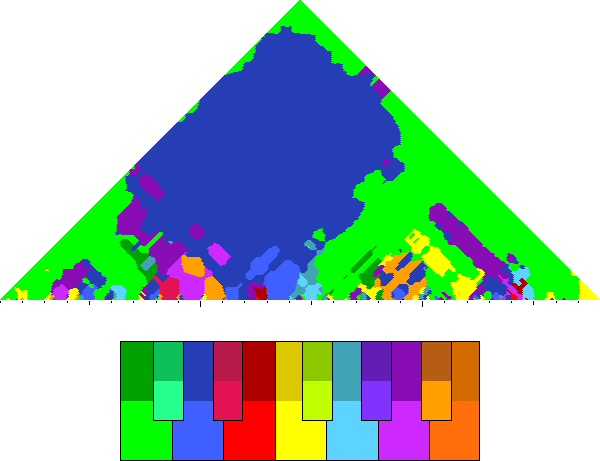
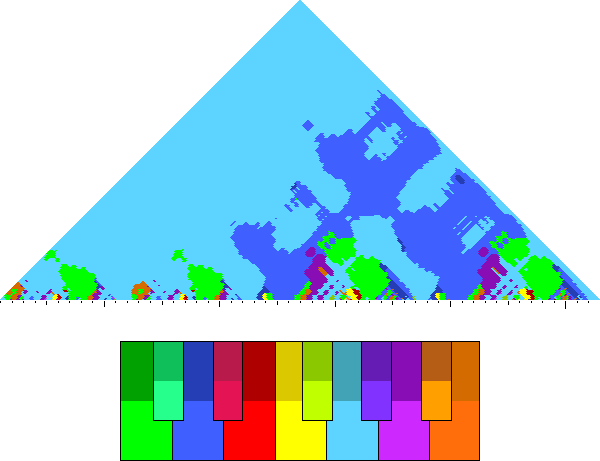
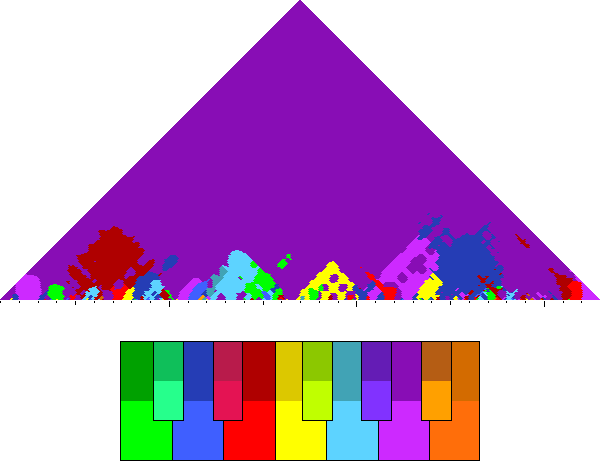
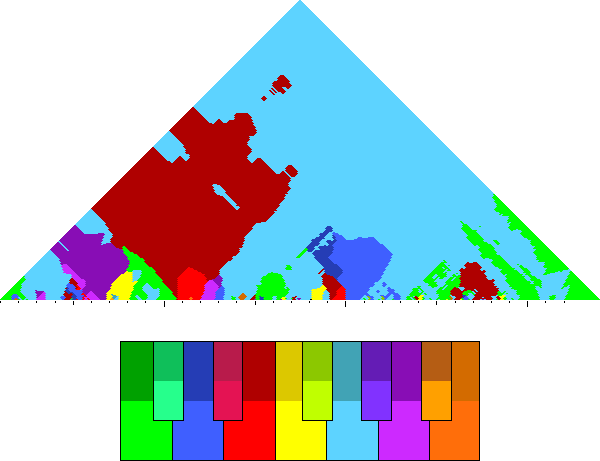
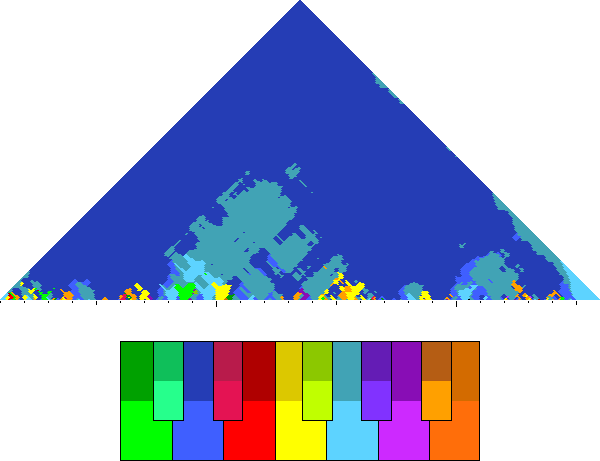
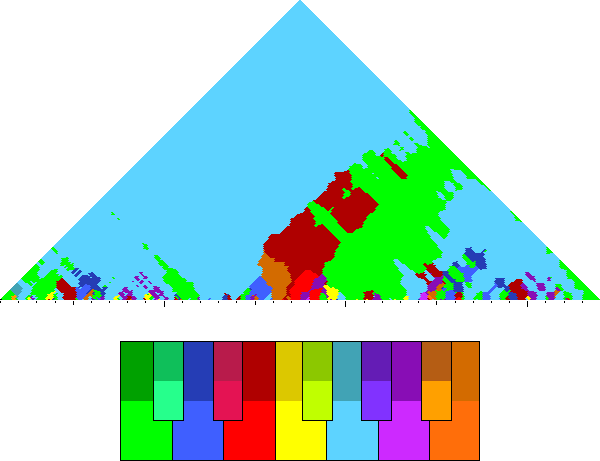
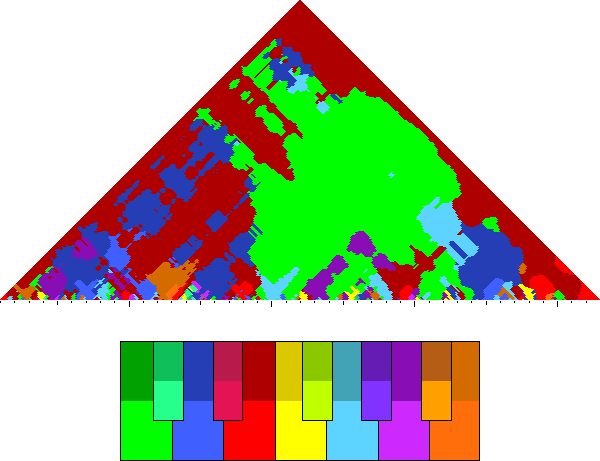
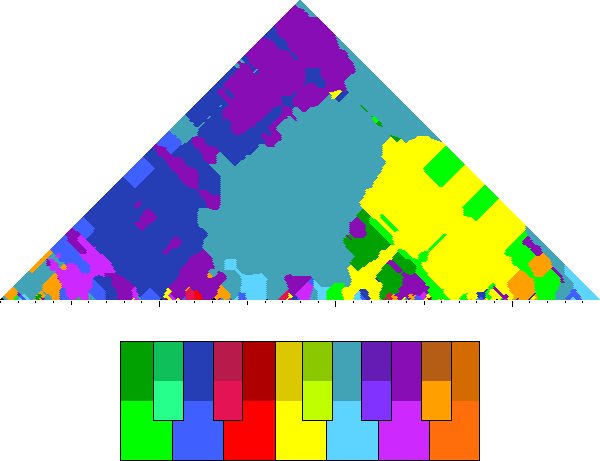
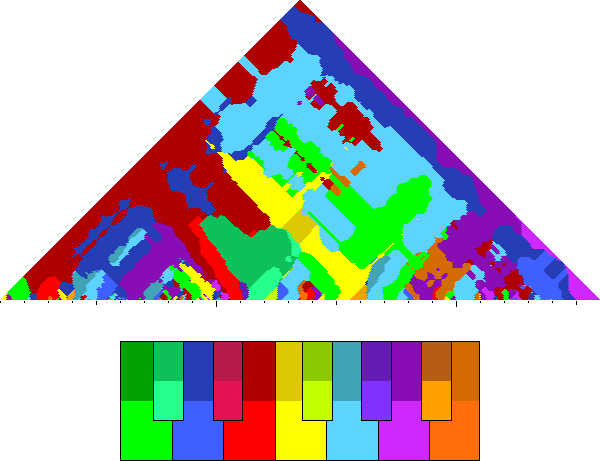
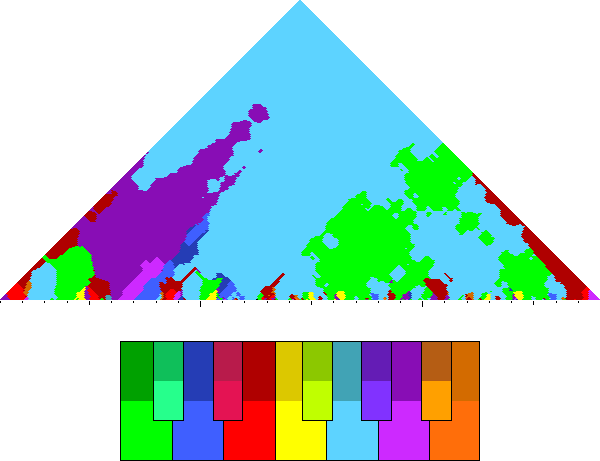
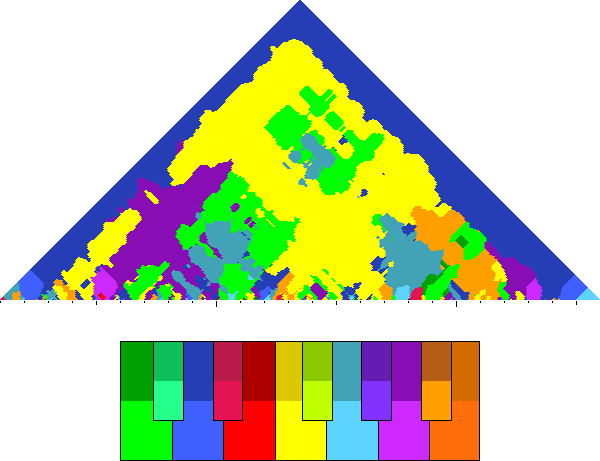
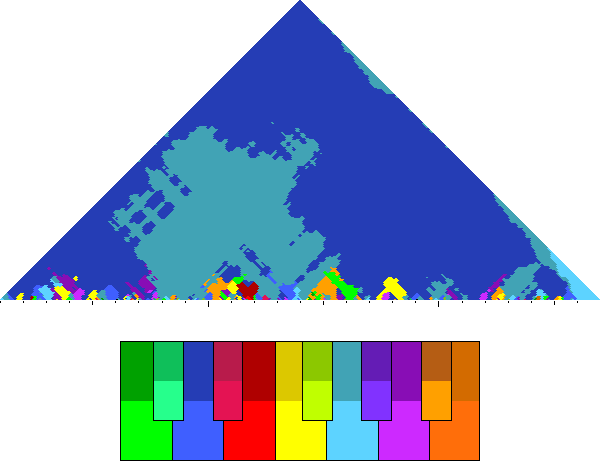
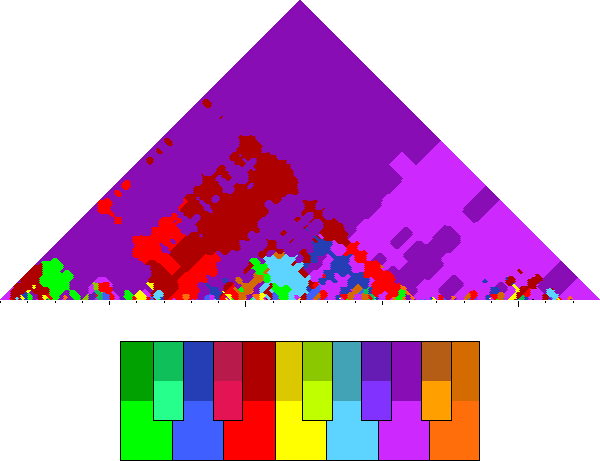
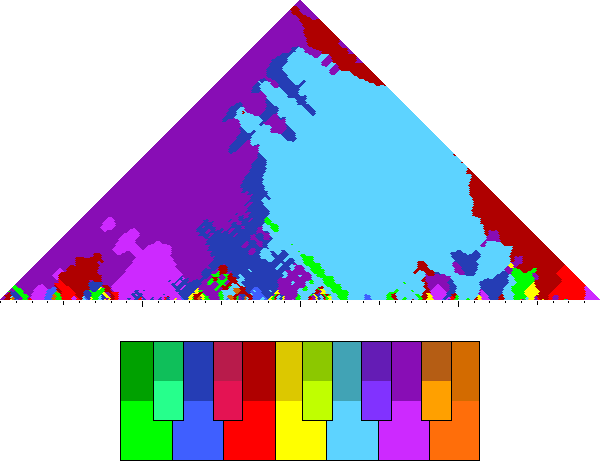
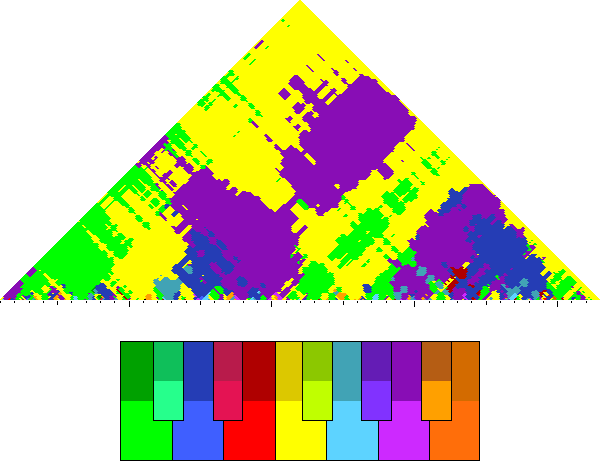
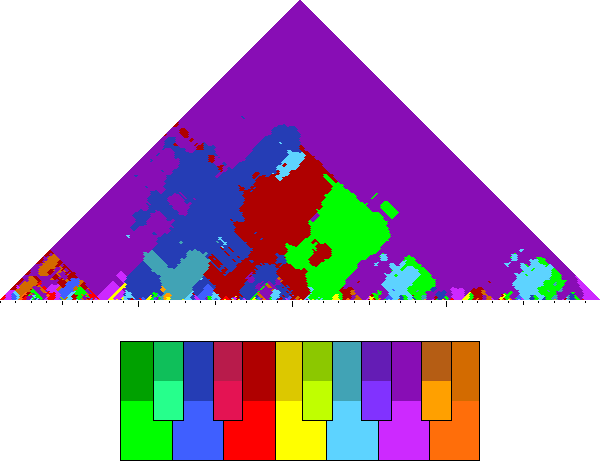
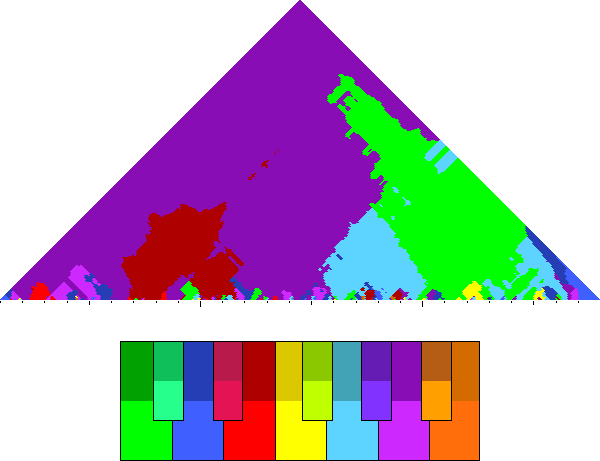
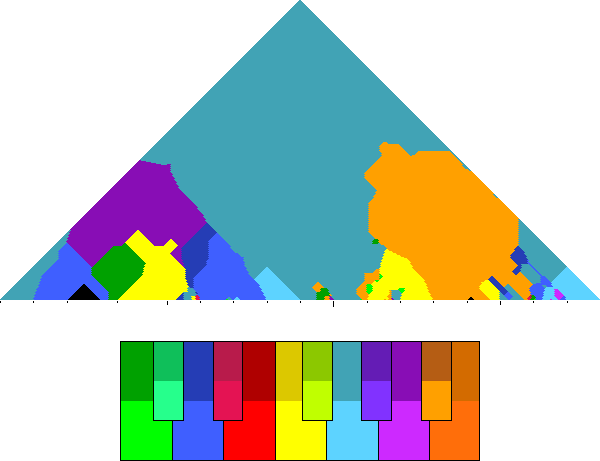
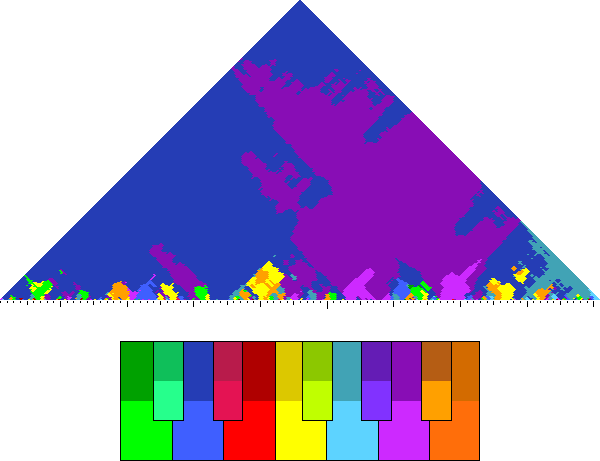
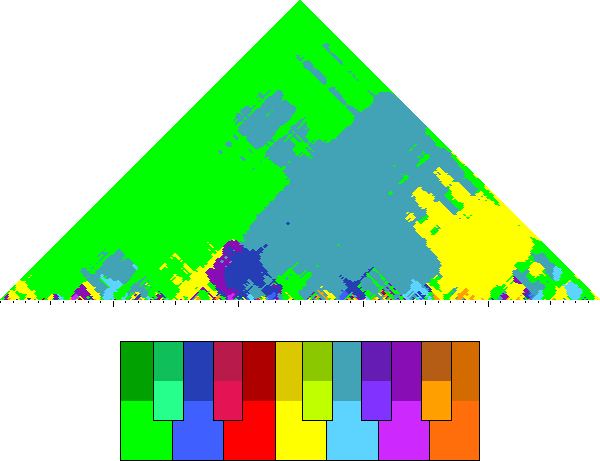
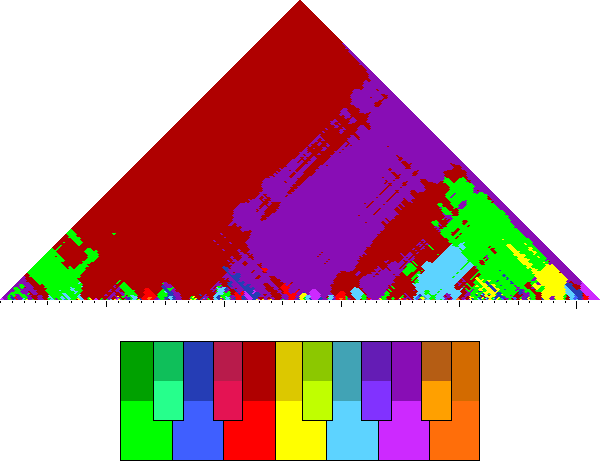
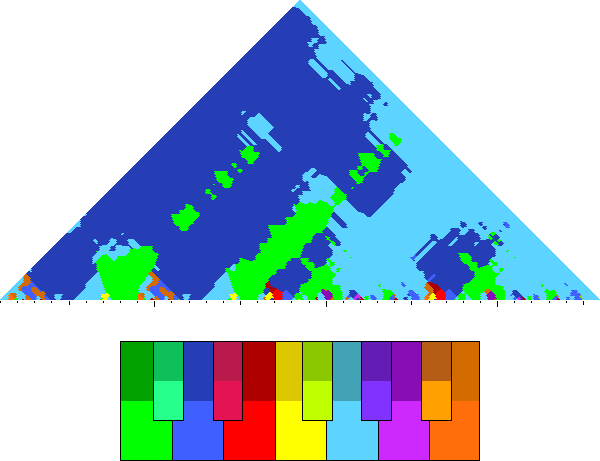
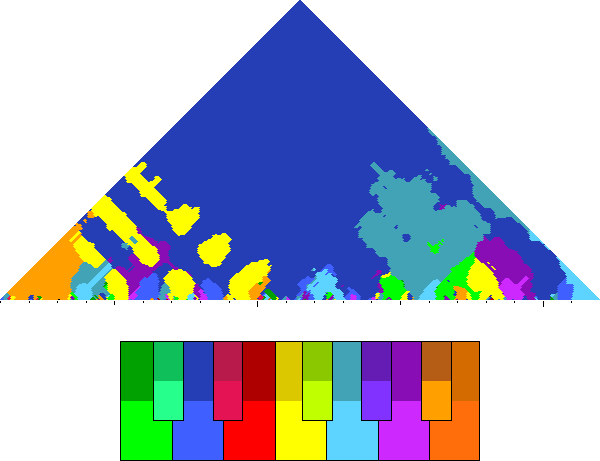
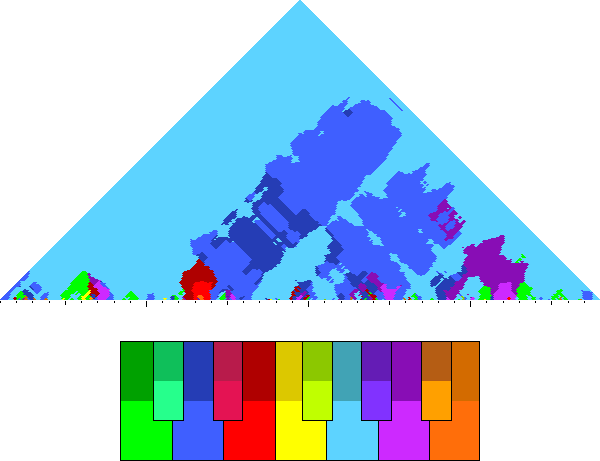
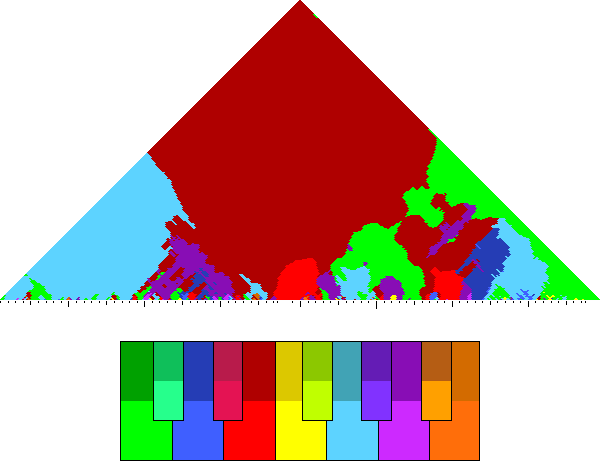
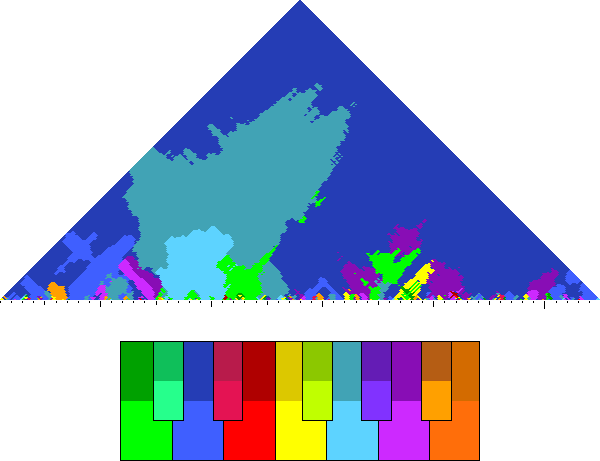
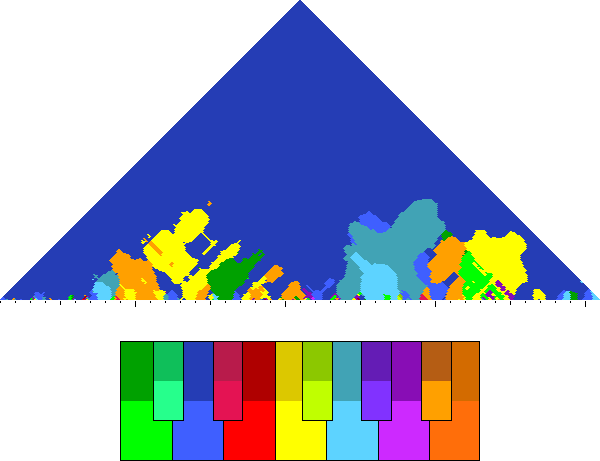
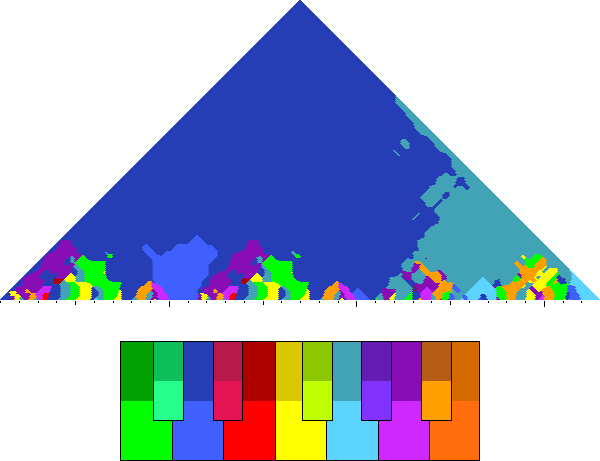
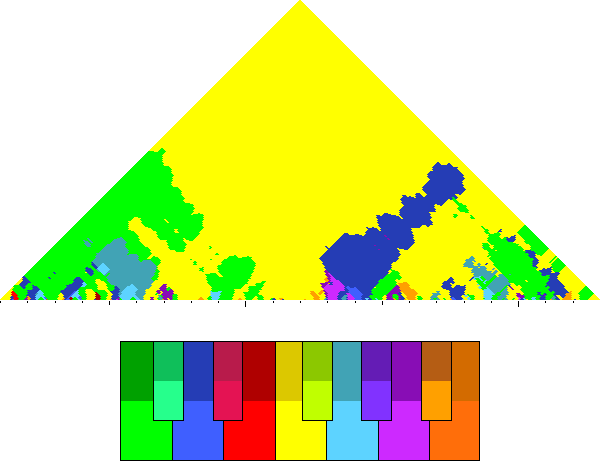
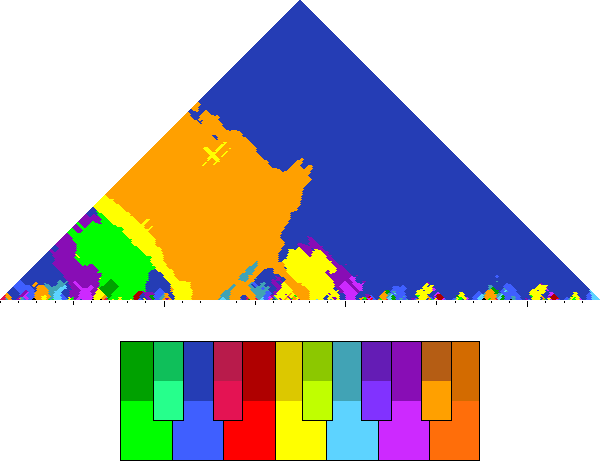
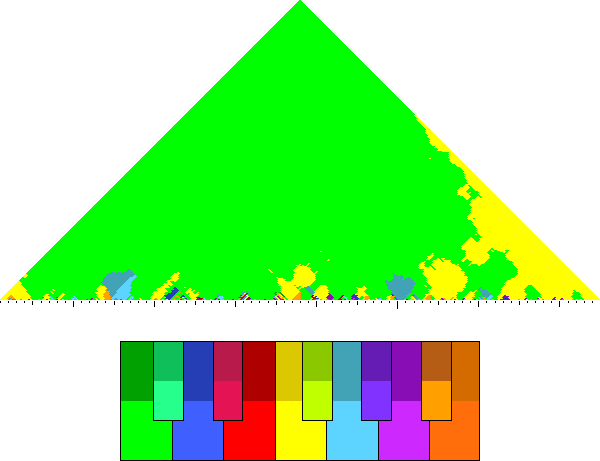
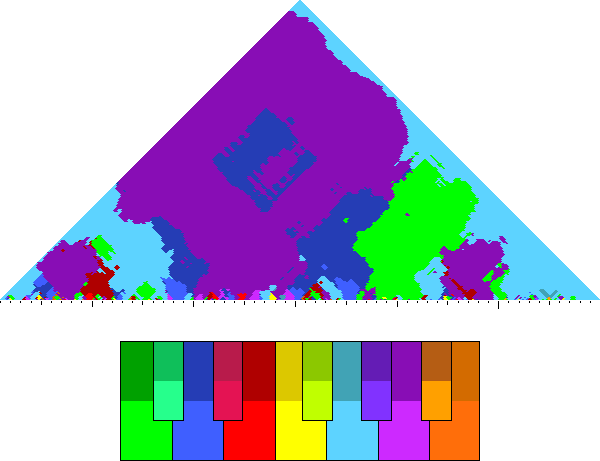
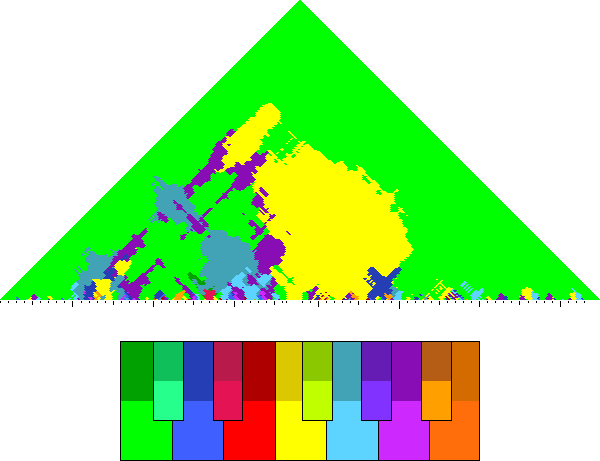
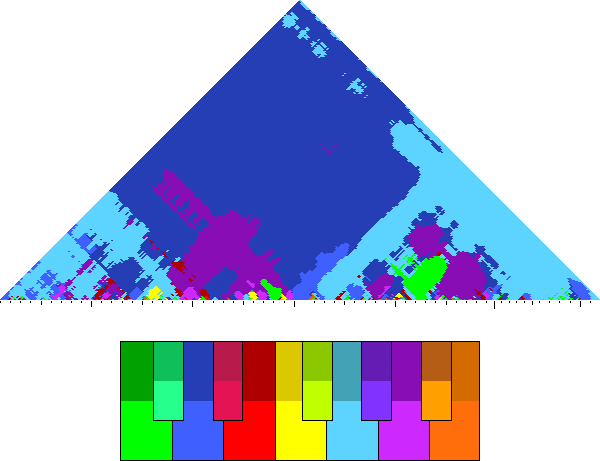
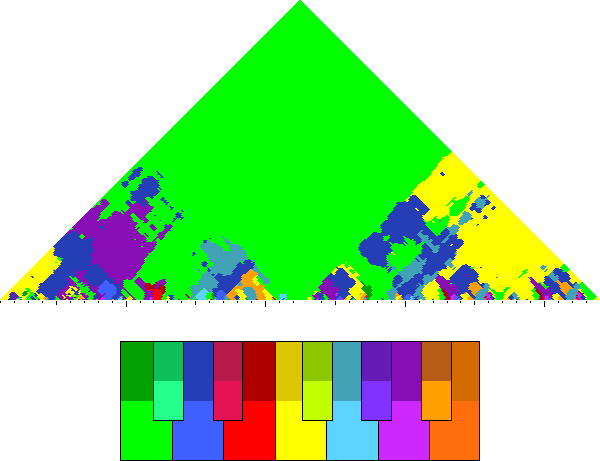
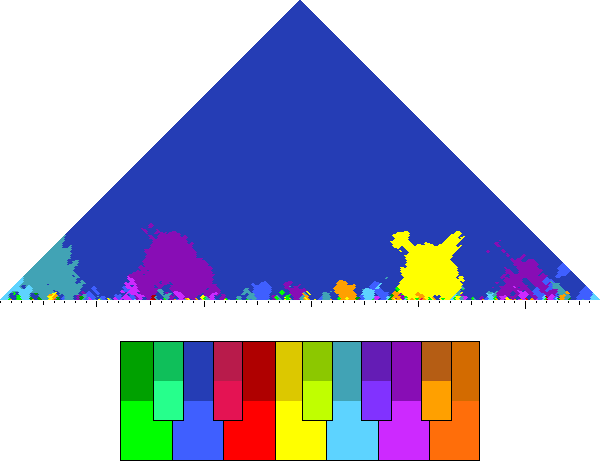
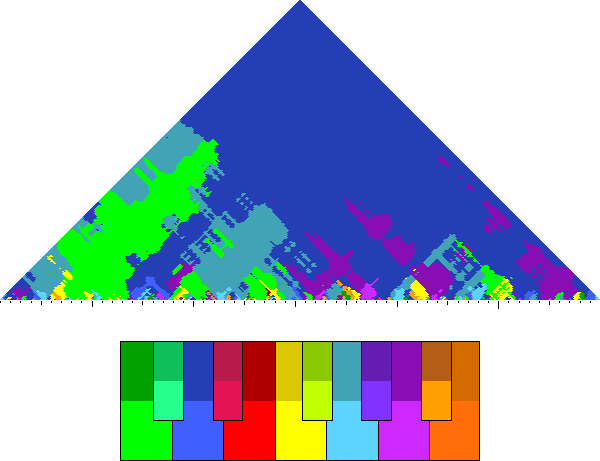
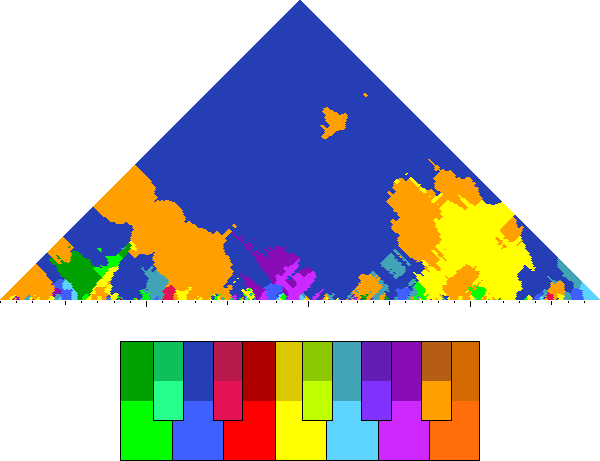
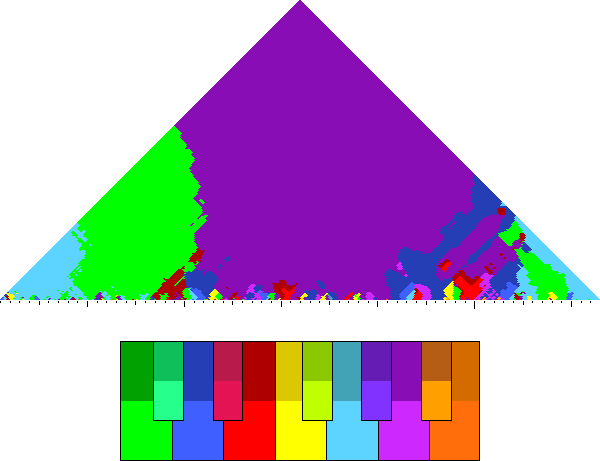
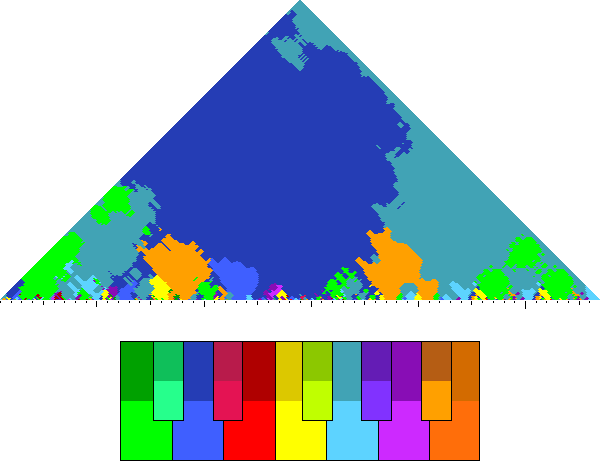
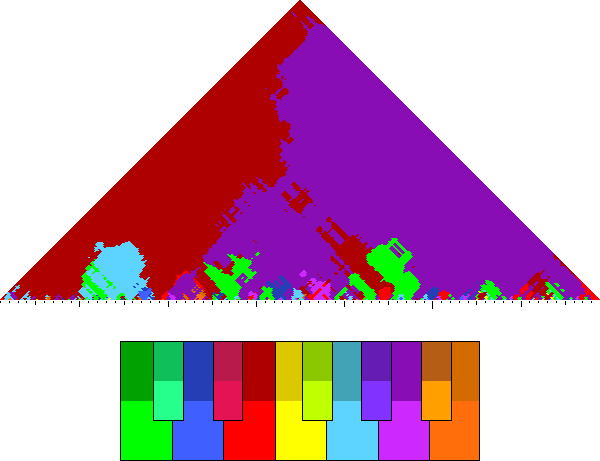
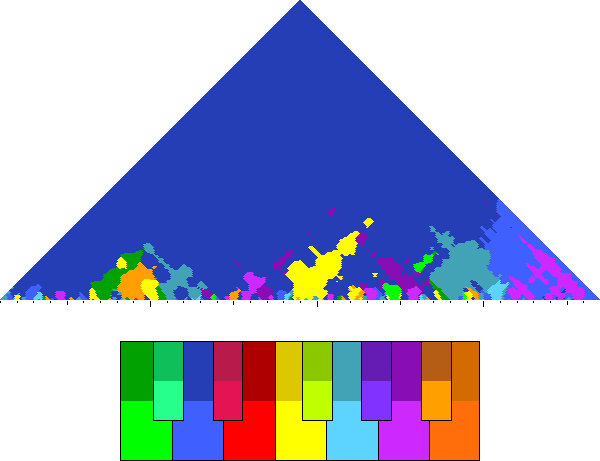
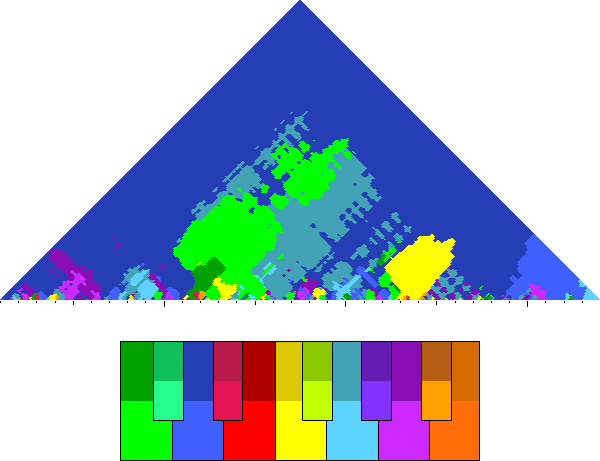
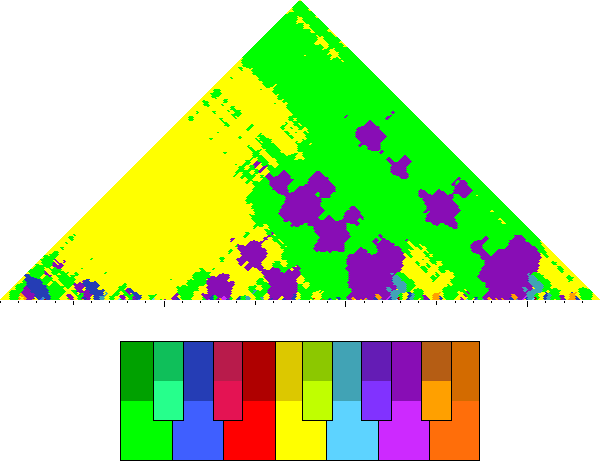
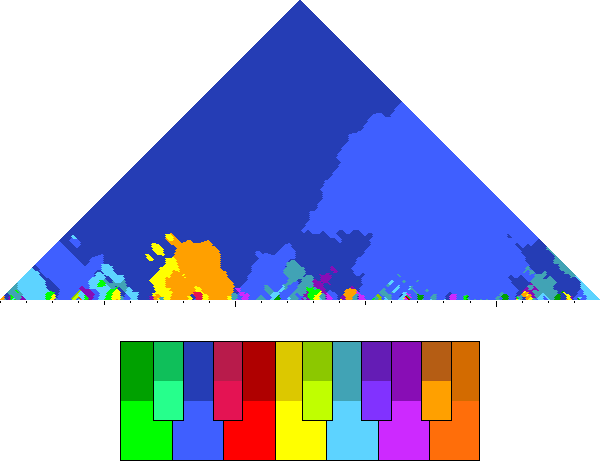
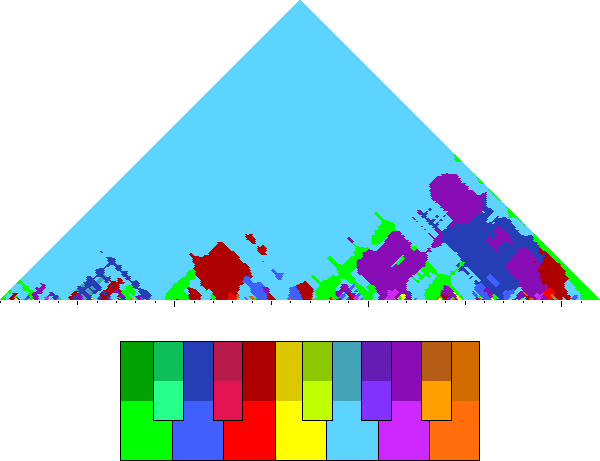
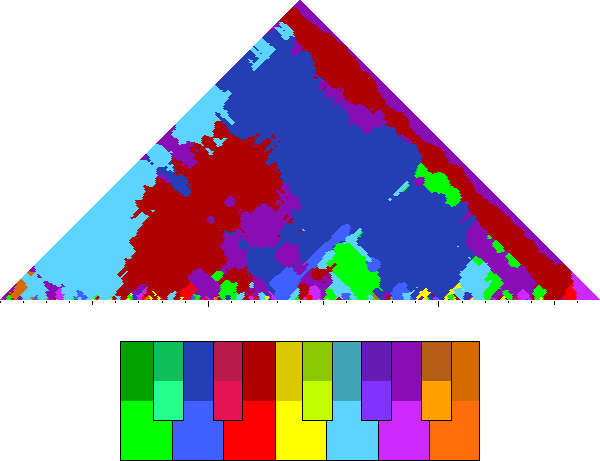
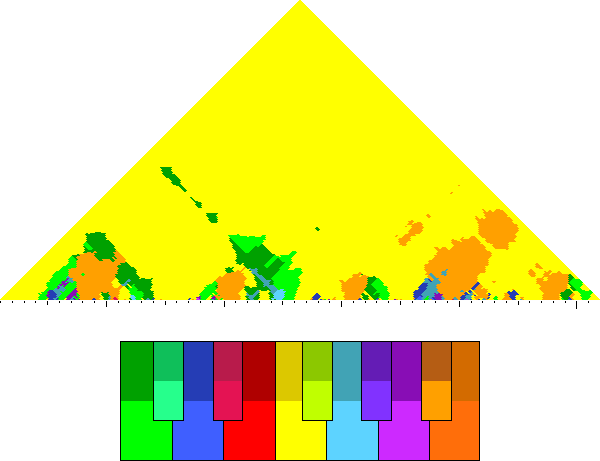
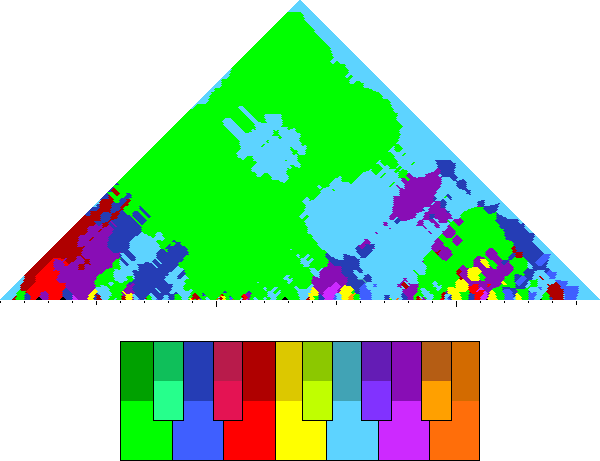
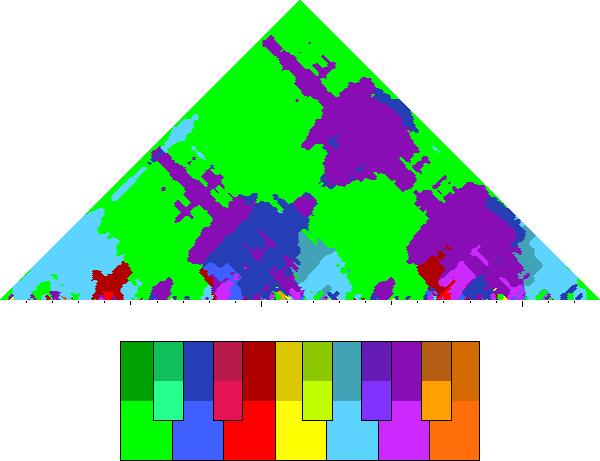
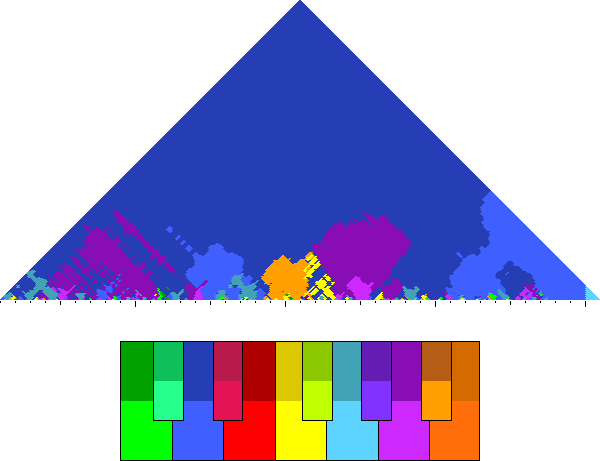
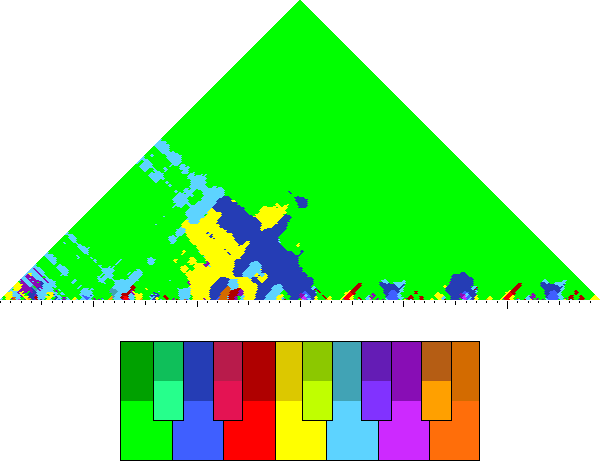
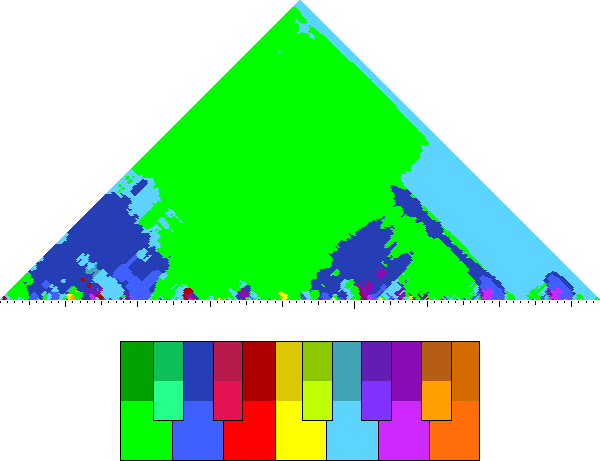
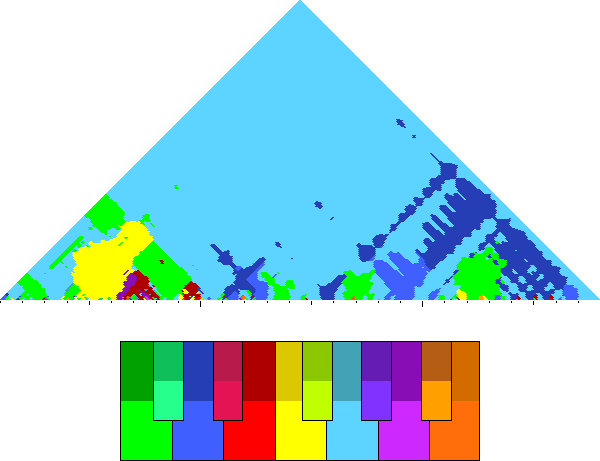
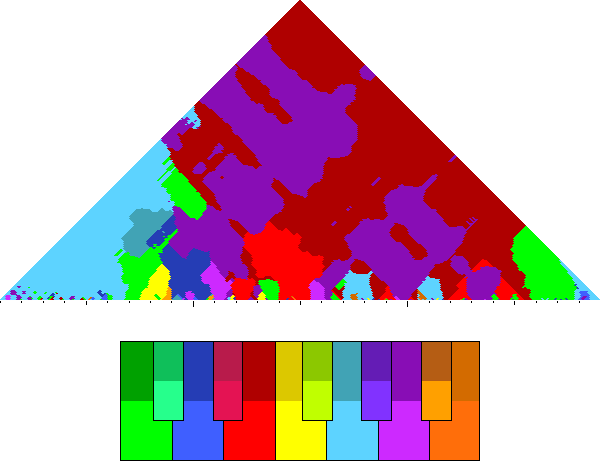
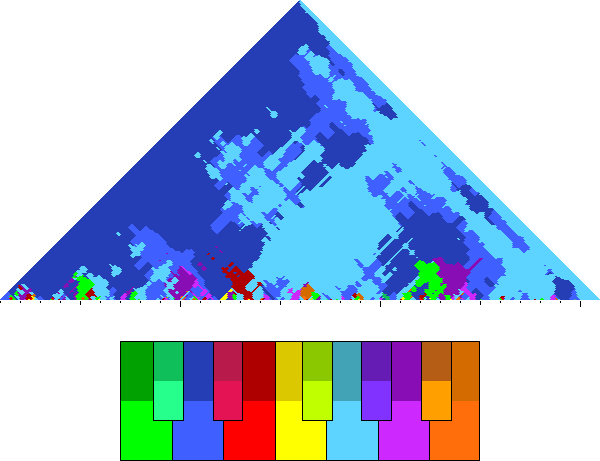
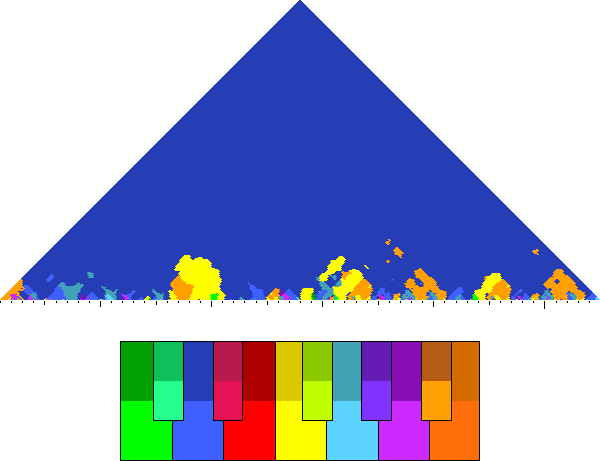
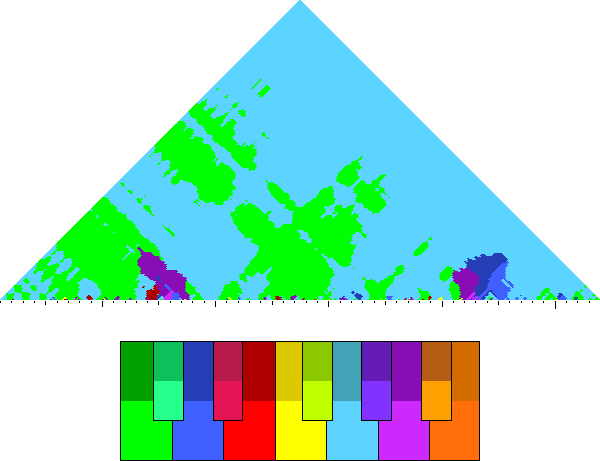
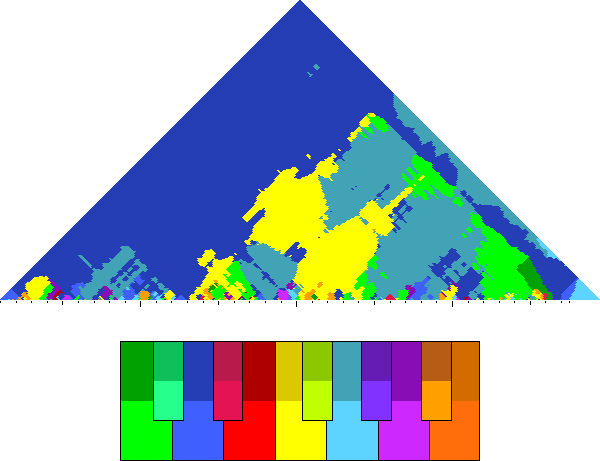
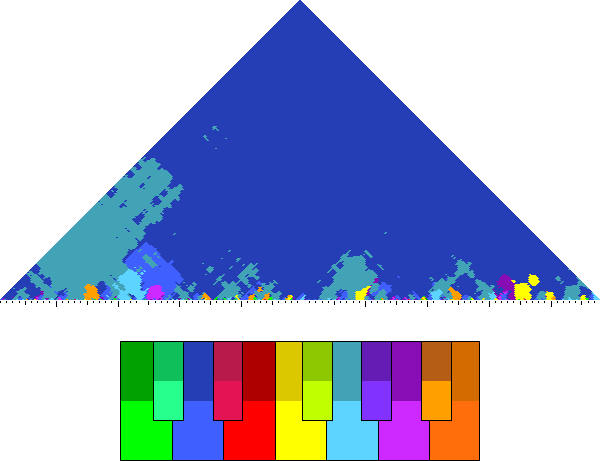
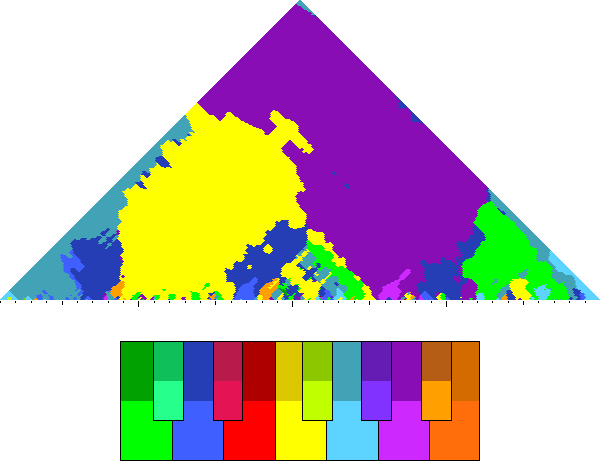
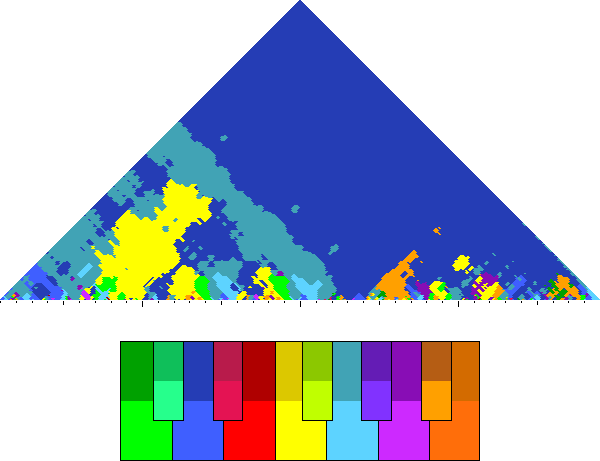
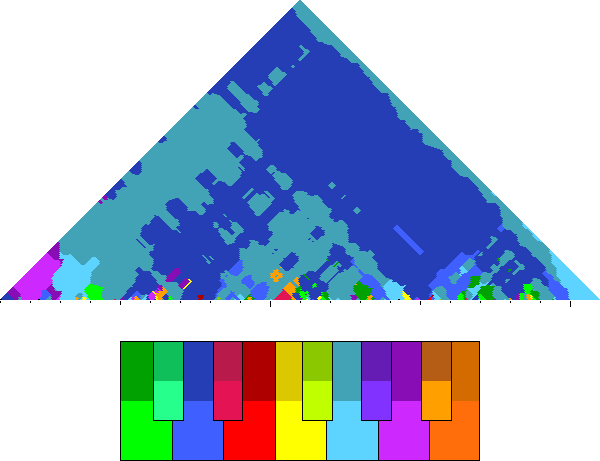
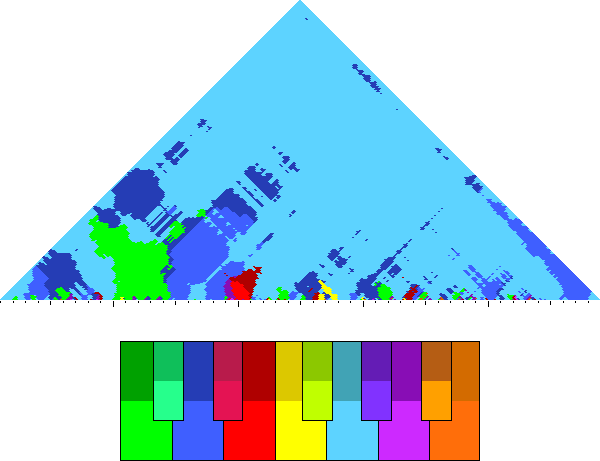
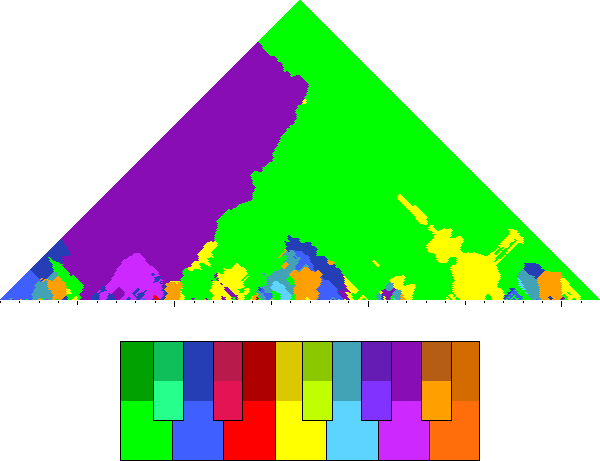
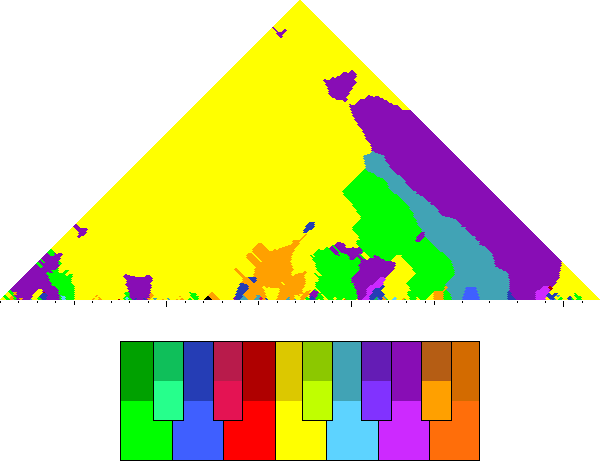
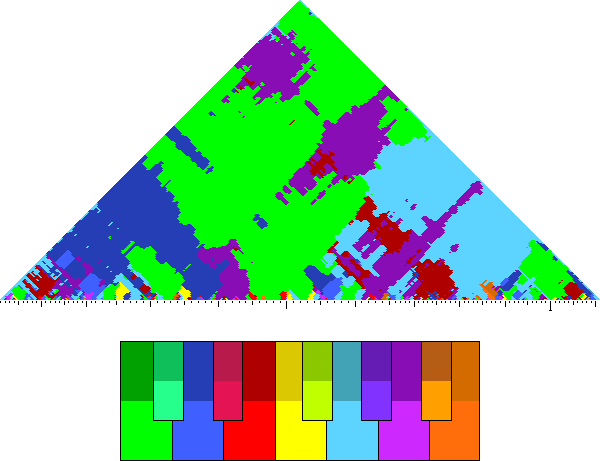
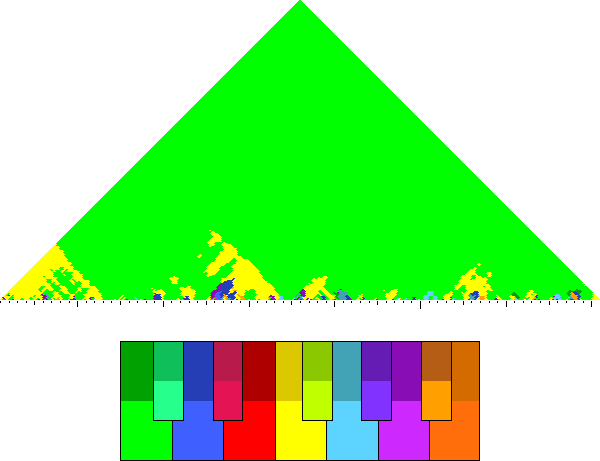
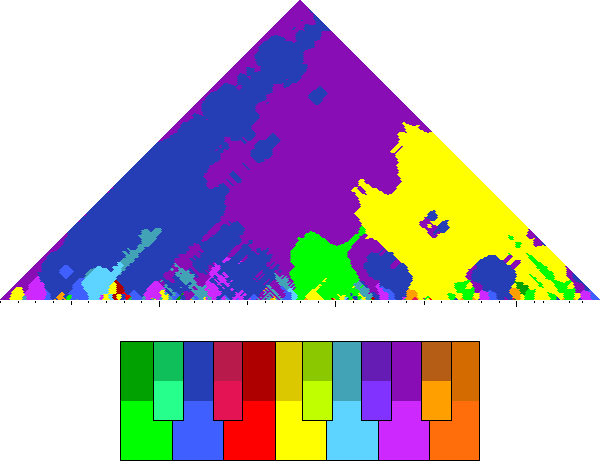
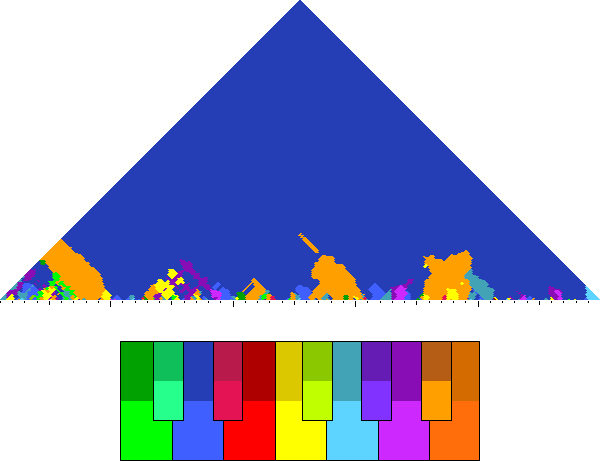
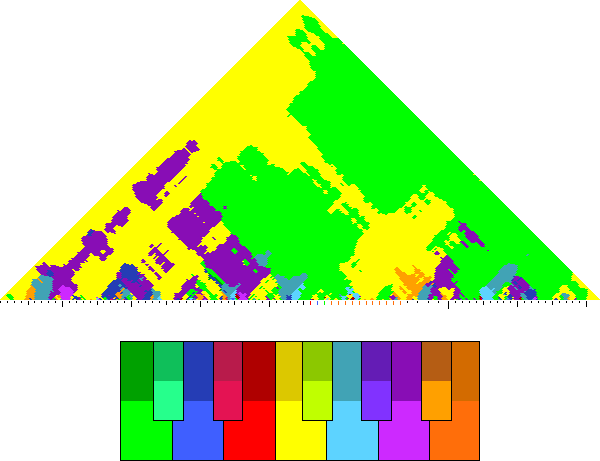
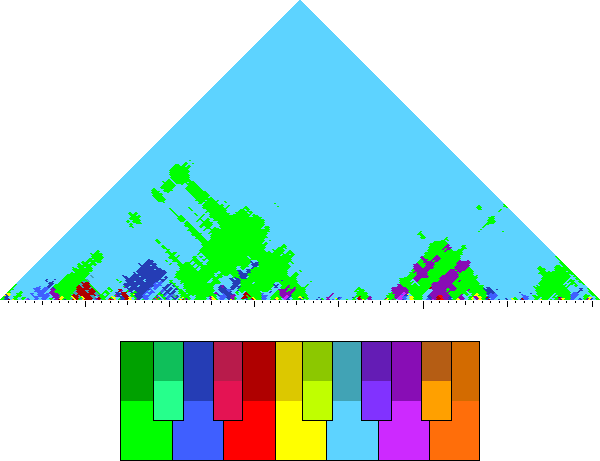
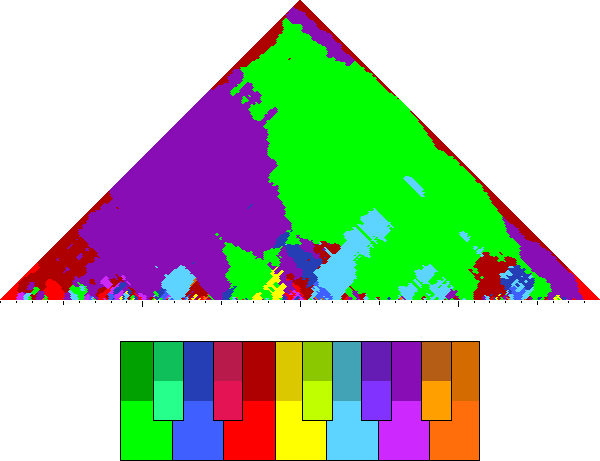
The triangular pitchscape plot underneath the two histograms
displays changes in the most common pitch class throughout the
piece. The keyboard underneath the pitchscape shows the color to
pitch-class mappings. Notice that the most common pitch class in
the duration-weighted histogram (the highest bar in the plot above,
left) is the pitch class represented at the apex of the pitchscape
plot. The final note is shown at the bottom right corner of the plot.
Time in the music goes from left-to-right in the pitchscape plot
with tick-marks under the triangle representing barlines in the
score. Every point in the plot represent a specific time range in
the music, with higher points encompassing more of the music and
lower points shorter excerpts of the music. Imagine scaling the
large triangular shape of the plot to a specific point in the plot:
the bottom of this scaled triangle indicates the range of music
that the point represents.
Each pitch class can be displayed in two different shades that
indicates which is greater of the major or minor third above the
most common pitch. For example, darker purple indicates that A is
the most common pitch class and C is more common that C♯;
while light purple means A is the most common pitch class and
C♯ is more common than C. This shading can sometimes help
to see cadence points in the pitchscape where an A major triad is
used when otherwise an A minor triad may be expected from the key
signature.
|
ID
|
Trm0003b
|
|
Composer
|
Marenzio, Luca / 1585
|
|
Title
|
Su l'ampia fronte il crespo oro lucente (rime 3)
|
|
Final
|
(A)D
|
|
Key sig.
|
♮
|
|
Clefs
|
G2, G2, C2, C3, C3, F3
|
|
|
Pitchscape
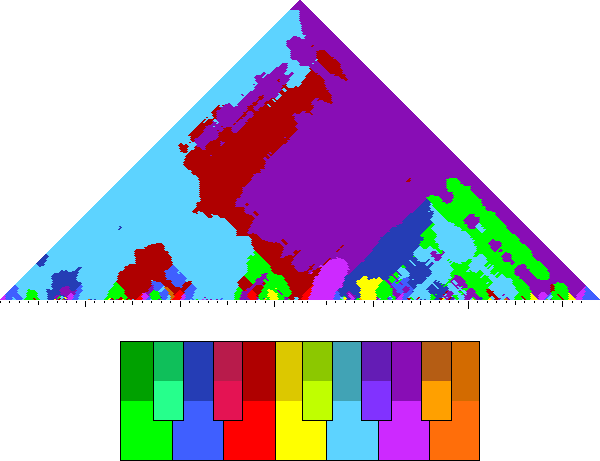
play
|
|
ID
|
Trm0023c
|
|
Composer
|
Felis, Stefano / 1591
|
|
Title
|
Io non posso gioire (rime 23)
|
|
Final
|
G
|
|
Key sig.
|
♭
|
|
Clefs
|
G2, G2, C2, C3, F3
|
|
|
Pitchscape
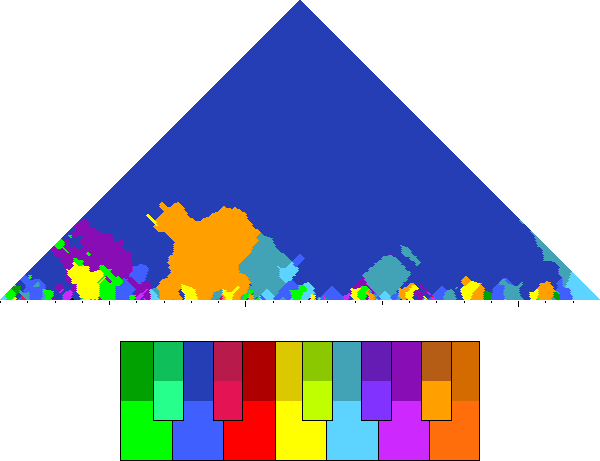
play
|
|
ID
|
Trm0023e
|
|
Composer
|
Pallavicino, Benedetto / 1612
|
|
Title
|
Io non posso gioire (rime 23)
|
|
Final
|
G
|
|
Key sig.
|
♮
|
|
Clefs
|
G2, G2, C2, C3, C4
|
|
|
Pitchscape
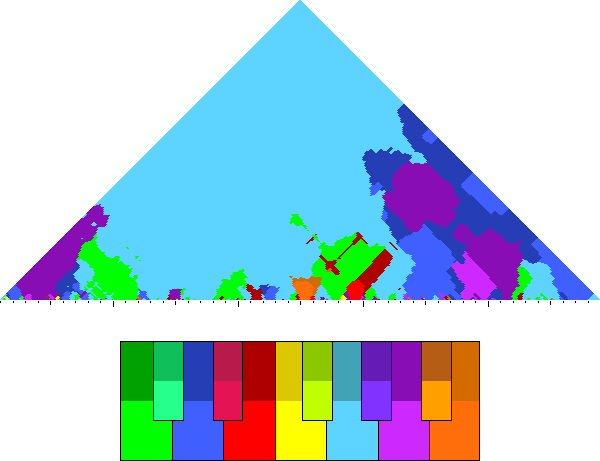
play
|
|
ID
|
Trm0024a
|
|
Composer
|
Felis, Stefano / 1591
|
|
Title
|
Già non son io contento (rime 24)
|
|
Final
|
G
|
|
Key sig.
|
♭
|
|
Clefs
|
G2, G2, C2, C3, F4
|
|
|
Pitchscape
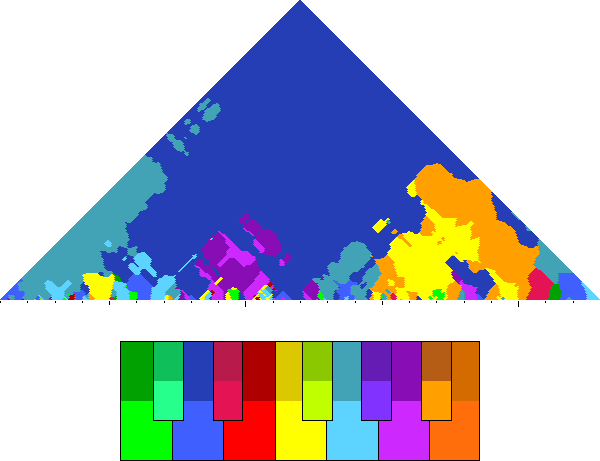
play
|
|
ID
|
Trm0025b
|
|
Composer
|
Pallavicino, Benedetto / 1600
|
|
Title
|
Come vivrò ne le mie pene, Amore (rime 25)
|
|
Final
|
G
|
|
Key sig.
|
♮
|
|
Clefs
|
C1, C3, C4, C4, F4
|
|
|
Pitchscape
play
|
|
ID
|
Trm0028a
|
|
Composer
|
Zanotti, Camillo / 1587
|
|
Title
|
Giacea la mia virtù vinta e smarrita (rime 28)
|
|
Final
|
(A)D
|
|
Key sig.
|
♮
|
|
Clefs
|
G2, C2, C3, C3, F3
|
|
|
Pitchscape
play
|
|
ID
|
Trm0038a
|
|
Composer
|
Porta, Costanzo / 1573
|
|
Title
|
Stavasi Amor quasi in regno assiso (rime 38)
|
|
Final
|
E
|
|
Key sig.
|
♮
|
|
Clefs
|
C1, C3, C4, C4, F4
|
|
|
Pitchscape
play
|
|
ID
|
Trm0047a
|
|
Composer
|
Pallavicino, Benedetto / 1579
|
|
Title
|
Non è questa la mano (rime 47)
|
|
Final
|
D
|
|
Key sig.
|
♮
|
|
Clefs
|
C1, C3, C4, F4
|
|
|
Pitchscape
play
|
|
ID
|
Trm0047l
|
|
Composer
|
Gastoldi, Giovanni Giacomo / 1588
|
|
Title
|
Non è questa la mano (rime 47)
|
|
Final
|
D
|
|
Key sig.
|
♭
|
|
Clefs
|
G2, G2, C2, C3, F3
|
|
|
Pitchscape
play
|
|
ID
|
Trm0047m
|
|
Composer
|
Giovannelli, Ruggiero / 1588
|
|
Title
|
Non è questa la mano (rime 47)
|
|
Final
|
G
|
|
Key sig.
|
♮
|
|
Clefs
|
G2, C2, C3
|
|
|
Pitchscape
play
|
|
ID
|
Trm0047n
|
|
Composer
|
Castro, Jean de / 1591
|
|
Title
|
Non è questa la mano (rime 47)
|
|
Final
|
G
|
|
Key sig.
|
♮
|
|
Clefs
|
C1, C3, C4
|
|
|
Pitchscape
play
|
|
ID
|
Trm0047q
|
|
Composer
|
Gesualdo, Carlo / 1594
|
|
Title
|
Non è questa la mano (rime 47)
|
|
Final
|
(D)A
|
|
Key sig.
|
♮
|
|
Clefs
|
G2, C1, C2, C3, F3
|
|
|
Pitchscape
play
|
|
ID
|
Trm0047s
|
|
Composer
|
Montella, Giovan Domenico / 1604
|
|
Title
|
Non è questa la mano (rime 47)
|
|
Final
|
F
|
|
Key sig.
|
♭
|
|
Clefs
|
G2, C2, C3, F3
|
|
|
Pitchscape
play
|
|
ID
|
Trm0048a
|
|
Composer
|
Meldert, Leonardo / 1575
|
|
Title
|
Amor l'alma m'allaccia (rime 48)
|
|
Final
|
F
|
|
Key sig.
|
♭
|
|
Clefs
|
C1, C3, C4, C4, F4
|
|
|
Pitchscape
play
|
|
ID
|
Trm0048e
|
|
Composer
|
Monte, Filippo di / 1590
|
|
Title
|
Amor l'alma m'allaccia (rime 48)
|
|
Final
|
G
|
|
Key sig.
|
♭
|
|
Clefs
|
C1, C1, C3, C4, F4
|
|
|
Pitchscape
play
|
|
ID
|
Trm0048f
|
|
Composer
|
Bonini, Pietro Andrea / 1591
|
|
Title
|
Amor l'alma m'allaccia (rime 48)
|
|
Final
|
D
|
|
Key sig.
|
♮
|
|
Clefs
|
C1, C1, C3, C4, F4
|
|
|
Pitchscape
play
|
|
ID
|
Trm0052a
|
|
Composer
|
Zanotti, Camillo / 1587
|
|
Title
|
O nemica d'Amor, che sì ti rendi (rime 52)
|
|
Final
|
(A)E
|
|
Key sig.
|
♮
|
|
Clefs
|
C1, C1, C3, C4, F4
|
|
|
Pitchscape
play
|
|
ID
|
Trm0059b
|
|
Composer
|
Felis, Stefano / 1591
|
|
Title
|
Lunge da voi, ben mio (rime 59)
|
|
Final
|
A
|
|
Key sig.
|
♮
|
|
Clefs
|
G2, G2, C2, C3, C4
|
|
|
Pitchscape
play
|
|
ID
|
Trm0059c
|
|
Composer
|
Pallavicino, Benedetto / 1600
|
|
Title
|
Lunge da voi, ben mio (rime 59)
|
|
Final
|
G
|
|
Key sig.
|
♭
|
|
Clefs
|
C1, C1, C3, C4, F4
|
|
|
Pitchscape
play
|
|
ID
|
Trm0059e
|
|
Composer
|
Dering, Richard / 1620
|
|
Title
|
Lunge da voi, ben mio (rime 59)
|
|
Final
|
G
|
|
Key sig.
|
♮
|
|
Clefs
|
G2, G2, C2, C4, C4
|
|
|
Pitchscape
play
|
|
ID
|
Trm0060c
|
|
Composer
|
Felis, Stefano / 1591
|
|
Title
|
Lunge da voi, mio core (rime 60)
|
|
Final
|
A
|
|
Key sig.
|
♮
|
|
Clefs
|
G2, G2, C2, C3, C4
|
|
|
Pitchscape
play
|
|
ID
|
Trm0088a
|
|
Composer
|
Meldert, Leonardo / 1575
|
|
Title
|
M'apre talor madonna il suo celeste (rime 88)
|
|
Final
|
G
|
|
Key sig.
|
♮
|
|
Clefs
|
G2, C2, C3, C3, F3
|
|
|
Pitchscape
play
|
|
ID
|
Trm0089a
|
|
Composer
|
Gesualdo, Carlo / 1594
|
|
Title
|
Mentre Madonna s'appoggiò pensosa (rime 89)
|
|
Final
|
G
|
|
Key sig.
|
♮
|
|
Clefs
|
G2, C2, C2, C3, F3
|
|
|
Pitchscape
play
|
|
ID
|
Trm0090b
|
|
Composer
|
Monte, Filippo di / 1588
|
|
Title
|
Mentre nubi di sdegno (rime 90)
|
|
Final
|
G
|
|
Key sig.
|
♮
|
|
Clefs
|
G2, G2, C2, C3, C4
|
|
|
Pitchscape
play
|
|
ID
|
Trm0090c
|
|
Composer
|
Cancineo, Michelangelo / 1590
|
|
Title
|
Mentre nubi di sdegno (rime 90)
|
|
Final
|
G
|
|
Key sig.
|
♭
|
|
Clefs
|
G2, C2, C3, F3
|
|
|
Pitchscape
play
|
|
ID
|
Trm0093a
|
|
Composer
|
Marenzio, Luca / 1584
|
|
Title
|
Disdegno e gelosia (rime 93)
|
|
Final
|
(C)F
|
|
Key sig.
|
♭
|
|
Clefs
|
C1, C3, C3, C4, F4
|
|
|
Pitchscape
play
|
|
ID
|
Trm0096a
|
|
Composer
|
D'India, Sigismondo / 1615
|
|
Title
|
Donna quanto più a dentro (rime 96)
|
|
Final
|
D
|
|
Key sig.
|
♭
|
|
Clefs
|
C1, C1, C3, C4, F4, F4
|
|
|
Pitchscape
play
|
|
ID
|
Trm0097b
|
|
Composer
|
Hassler, Hans Leo / 1596
|
|
Title
|
A chi creder degg'io (rime 97)
|
|
Final
|
G
|
|
Key sig.
|
♭
|
|
Clefs
|
G2, G2, C2, C3, F3
|
|
|
Pitchscape
play
|
|
ID
|
Trm0099a
|
|
Composer
|
Luzzaschi, Luzzasco / 1576
|
|
Title
|
Geloso amante apro mill'occhi e giro (rime 99)
|
|
Final
|
(E)A
|
|
Key sig.
|
♮
|
|
Clefs
|
G2, C2, C3, C3, F3
|
|
|
Pitchscape
play
|
|
ID
|
Trm0107a
|
|
Composer
|
Marenzio, Luca / 1587
|
|
Title
|
Arsi gran tempo, e del mio foco indegno (rime 107)
|
|
Final
|
(D)G
|
|
Key sig.
|
♭
|
|
Clefs
|
C1, C3, C3, C4, C4, F4
|
|
|
Pitchscape
play
|
|
ID
|
Trm0126a
|
|
Composer
|
Gabella, Giovanni Battista / 1585
|
|
Title
|
Tre gran donne vid'io ch'in esser belle (rime 126)
|
|
Final
|
G
|
|
Key sig.
|
♮
|
|
Clefs
|
C1, C3, C4, C4, F4
|
|
|
Pitchscape
play
|
|
ID
|
Trm0137a
|
|
Composer
|
Virchi, Paolo / 1584
|
|
Title
|
Non fonte o fiume od aura (rime 137)
|
|
Final
|
G
|
|
Key sig.
|
♭
|
|
Clefs
|
G2, G2, C2, C3, F3
|
|
|
Pitchscape
play
|
|
ID
|
Trm0137b
|
|
Composer
|
Bozi, Paolo / 1591
|
|
Title
|
Non fonte o fiume od aura (rime 137)
|
|
Final
|
G
|
|
Key sig.
|
♭
|
|
Clefs
|
G2, G2, C3
|
|
|
Pitchscape
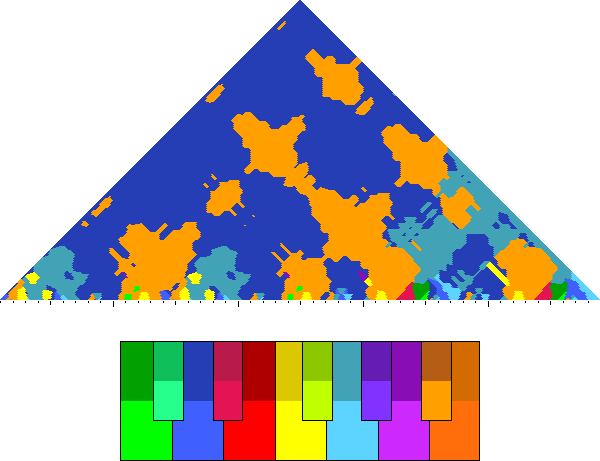
play
|
|
ID
|
Trm0139a
|
|
Composer
|
Villani, Gabriele / 1591
|
|
Title
|
Messaggera de l'alba (rime 139)
|
|
Final
|
D
|
|
Key sig.
|
♭
|
|
Clefs
|
C1, C1, C3, C4
|
|
|
Pitchscape
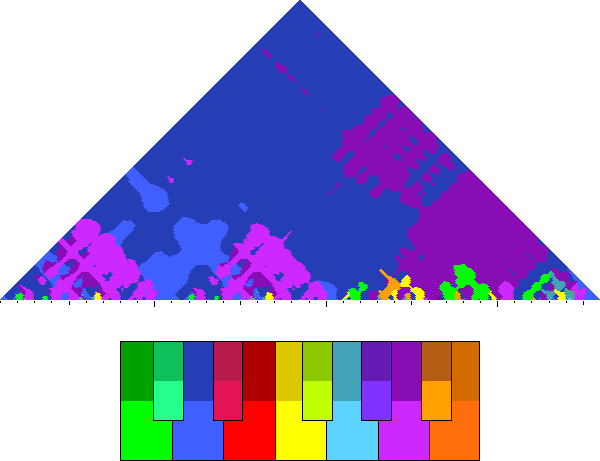
play
|
|
ID
|
Trm0143a
|
|
Composer
|
Dueto, Antonio / 1586
|
|
Title
|
Ecco mormorar l'onde (rime 143)
|
|
Final
|
C
|
|
Key sig.
|
♭
|
|
Clefs
|
G2, C2, C3, F3
|
|
|
Pitchscape
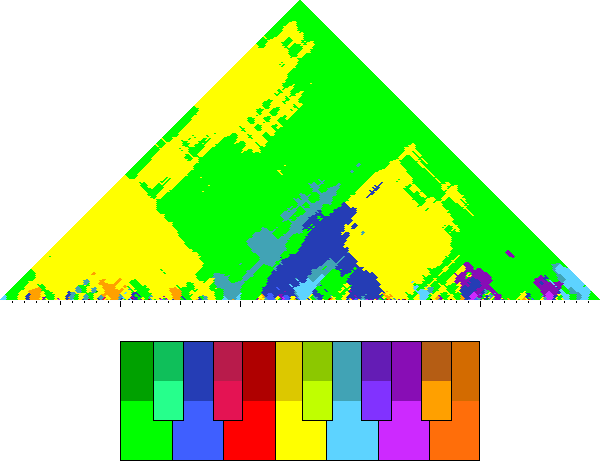
play
|
|
ID
|
Trm0144a
|
|
Composer
|
Dueto, Antonio / 1586
|
|
Title
|
Ore fermate il volo (rime 144)
|
|
Final
|
D
|
|
Key sig.
|
♮
|
|
Clefs
|
G2, C2, C3, C4
|
|
|
Pitchscape
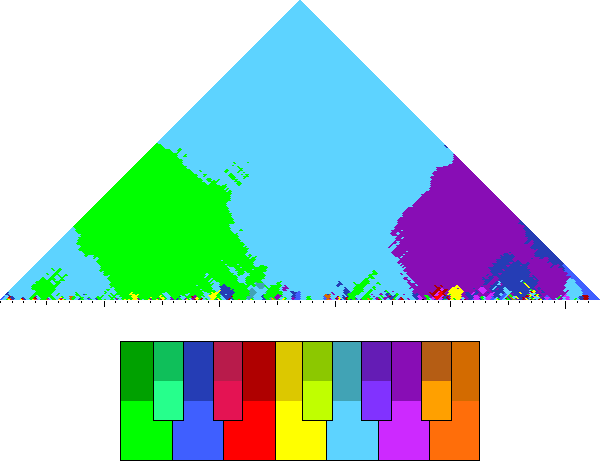
play
|
|
ID
|
Trm0152a
|
|
Composer
|
Pallavicino, Benedetto / 1604
|
|
Title
|
Voi mi chiedeste il core (rime 152)
|
|
Final
|
G
|
|
Key sig.
|
♮
|
|
Clefs
|
G2, G2, C2, C3, C4
|
|
|
Pitchscape
play
|
|
ID
|
Trm0159a
|
|
Composer
|
Veggio, Giovanni Agostino / 1574
|
|
Title
|
D'aria un tempo nudrimmi, e cibo e vita (rime 159)
|
|
Final
|
E
|
|
Key sig.
|
♮
|
|
Clefs
|
C1, C3, C4, C4, F4
|
|
|
Pitchscape
play
|
|
ID
|
Trm0159b
|
|
Composer
|
Feliciani, Andrea / 1579
|
|
Title
|
D'aria un tempo nudrimmi, e cibo e vita (rime 159)
|
|
Final
|
G
|
|
Key sig.
|
♭
|
|
Clefs
|
G2, C1, C2, C3, F3
|
|
|
Pitchscape
play
|
|
ID
|
Trm0164a
|
|
Composer
|
Barbarino, Bartolomeo / 1616
|
|
Title
|
Vuol che l'ami costei, ma duro freno (rime 164)
|
|
Final
|
F
|
|
Key sig.
|
♭
|
|
Clefs
|
C1, F4
|
|
|
Pitchscape
play
|
|
ID
|
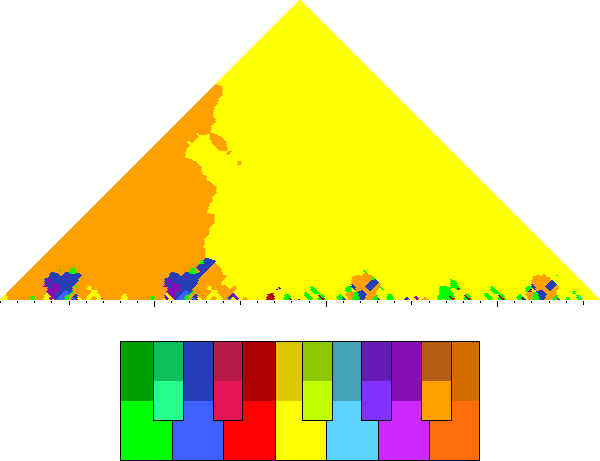
Trm0165d
|
|
Composer
|
Bozi, Paolo / 1591
|
|
Title
|
Vorrei lagnarmi a pieno (rime 165)
|
|
Final
|
F
|
|
Key sig.
|
♭
|
|
Clefs
|
G2, G2, C2
|
|
|
Pitchscape
play
|
|
ID
|
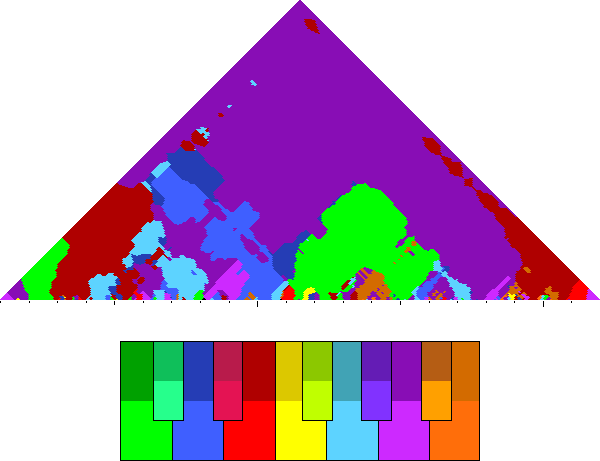
Trm0166g
|
|
Composer
|
Gesualdo, Carlo / 1594
|
|
Title
|
Se taccio, il duol s'avanza (rime 166)
|
|
Final
|
A
|
|
Key sig.
|
♮
|
|
Clefs
|
C1, C3, C4, C4, F4
|
|
|
Pitchscape
play
|
|
ID
|
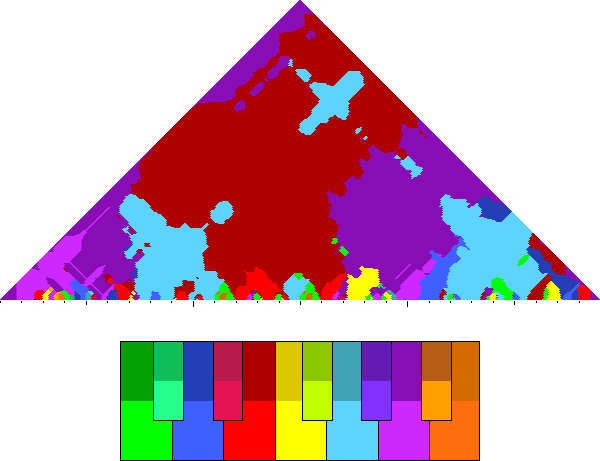
Trm0166k
|
|
Composer
|
Nenna, Pomponio / 1613
|
|
Title
|
Se taccio, il duol s'avanza (rime 166)
|
|
Final
|
A
|
|
Key sig.
|
♮
|
|
Clefs
|
C1, C3, C4, F4, F4
|
|
|
Pitchscape
play
|
|
ID
|
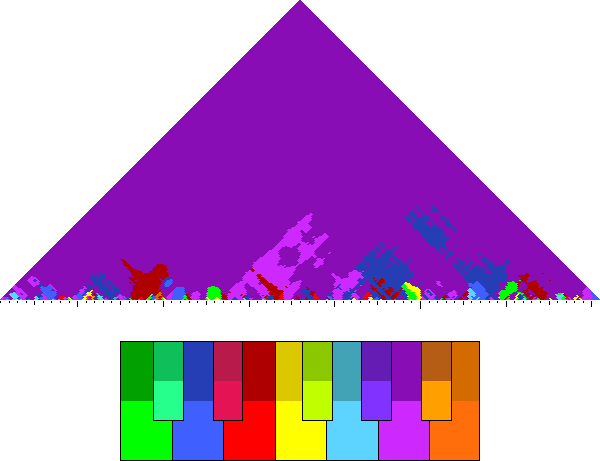
Trm0174a
|
|
Composer
|
Pozzo, Vincenzo dal / 1585
|
|
Title
|
Or che l'aura mia dolce altrove spira (rime 174)
|
|
Final
|
D
|
|
Key sig.
|
♮
|
|
Clefs
|
G2, G2, C2, C3, F3
|
|
|
Pitchscape
play
|
|
ID
|
Trm0175b
|
|
Composer
|
Il Verso, Antonio / 1605
|
|
Title
|
Vaghe Ninfe del Po, Ninfe sorelle (rime 175)
|
|
Final
|
F
|
|
Key sig.
|
♭
|
|
Clefs
|
C1, C2, C4
|
|
|
Pitchscape
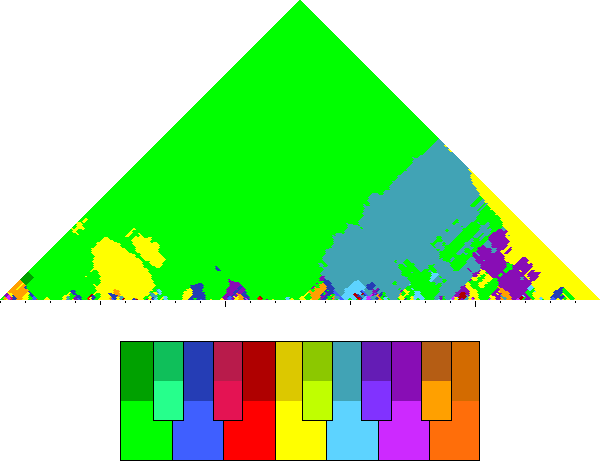
play
|
|
ID
|
Trm0183b
|
|
Composer
|
Marenzio, Luca / 1587
|
|
Title
|
Di nettare amoroso ebro la mente (rime 183)
|
|
Final
|
(A)D
|
|
Key sig.
|
♭
|
|
Clefs
|
G2, G2, C2, C3, C3, F3
|
|
|
Pitchscape
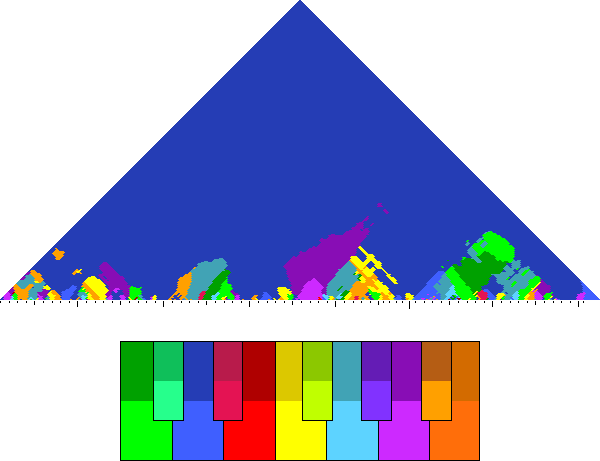
play
|
|
ID
|
Trm0189b
|
|
Composer
|
Tosone, Marcello / 1590
|
|
Title
|
Secco è l'arbor gentile (rime 189)
|
|
Final
|
F
|
|
Key sig.
|
♭
|
|
Clefs
|
G2, C2, C3, F3
|
|
|
Pitchscape
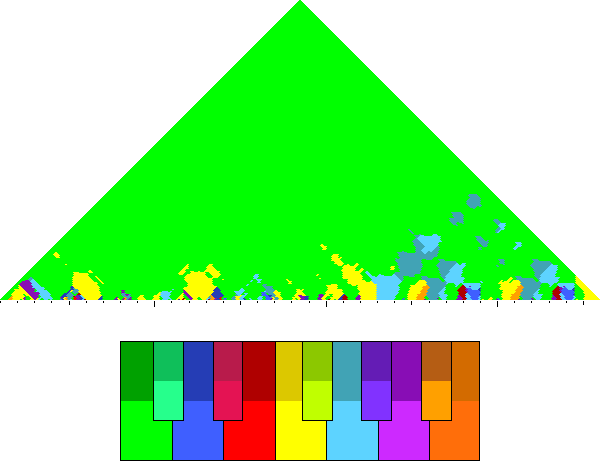
play
|
|
ID
|
Trm0191b
|
|
Composer
|
Tosone, Marcello / 1590
|
|
Title
|
Arsi mentre m'amaste (rime 191)
|
|
Final
|
A
|
|
Key sig.
|
♮
|
|
Clefs
|
G2, C2, C3, C4
|
|
|
Pitchscape
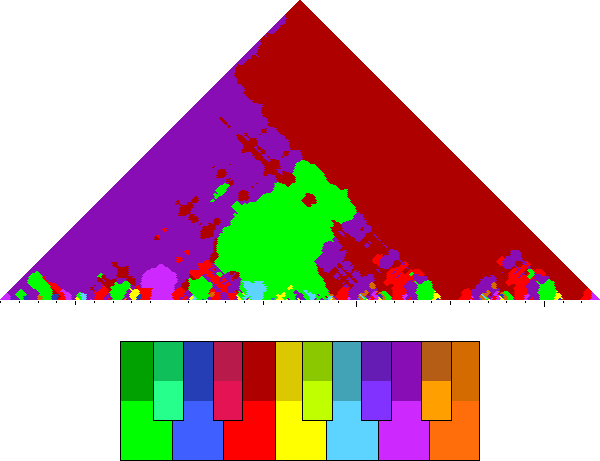
play
|
|
ID
|
Trm0194b
|
|
Composer
|
Naldi, Romolo / 1589
|
|
Title
|
La giovinetta scorza (rime 194)
|
|
Final
|
F
|
|
Key sig.
|
♭
|
|
Clefs
|
C1, C3, C3, C4, F4
|
|
|
Pitchscape
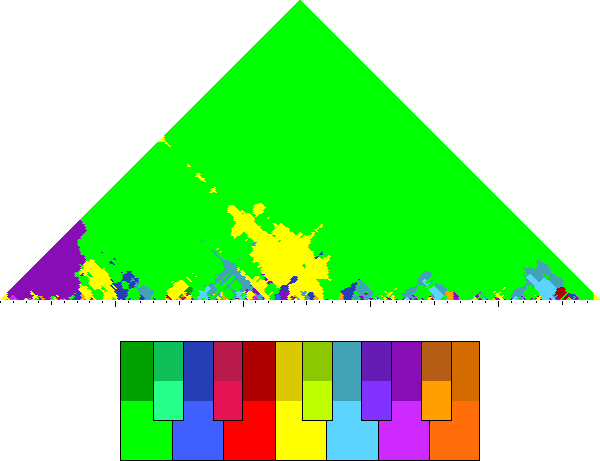
play
|
|
ID
|
Trm0198a
|
|
Composer
|
Vecoli, Regolo / 1586
|
|
Title
|
Chi la felice pianta d'orïente (rime 198)
|
|
Final
|
D
|
|
Key sig.
|
♮
|
|
Clefs
|
C1, C2, C4, C4, F4
|
|
|
Pitchscape
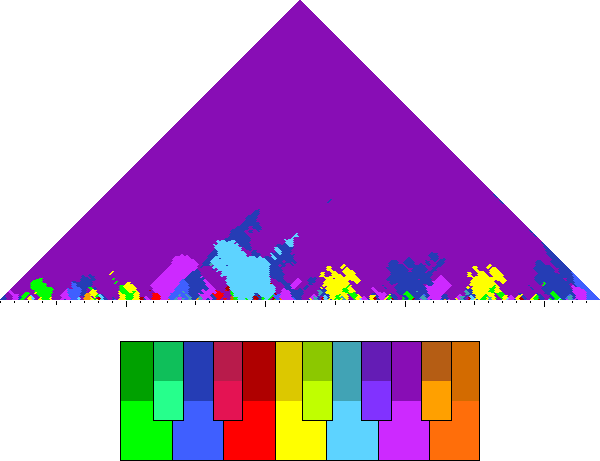
play
|
|
ID
|
Trm0202a
|
|
Composer
|
Agostini, Lodovico / 1582
|
|
Title
|
Picciola verga e bella (rime 202)
|
|
Final
|
E
|
|
Key sig.
|
♮
|
|
Clefs
|
C1, C1, C1, C3, C4, F4
|
|
|
Pitchscape
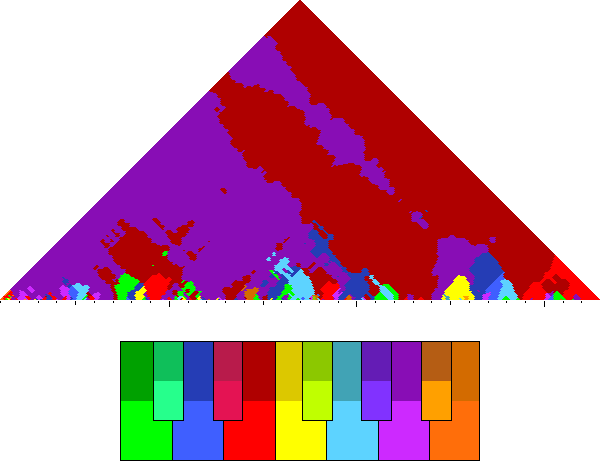
play
|
|
ID
|
Trm0237a
|
|
Composer
|
Meldert, Leonardo / 1575
|
|
Title
|
Negro era intorno e 'n bianche falde il cielo (rime 237)
|
|
Final
|
(E)A
|
|
Key sig.
|
♮
|
|
Clefs
|
G2, C2, C3, C3, F3
|
|
|
Pitchscape
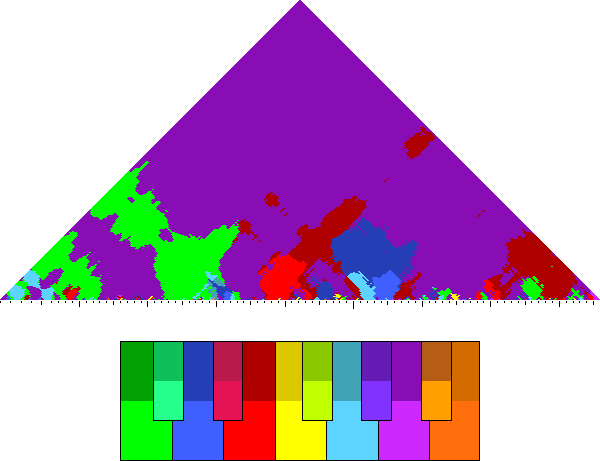
play
|
|
ID
|
Trm0241a
|
|
Composer
|
Nielsen, Hans / 1606
|
|
Title
|
Mentre i dipinti augelli (rime 241)
|
|
Final
|
G
|
|
Key sig.
|
♮
|
|
Clefs
|
C1, C1, C3, C4, F4
|
|
|
Pitchscape
play
|
|
ID
|
Trm0242a
|
|
Composer
|
Zenaro, Giulio / 1589
|
|
Title
|
Sovra l'erbetta e i fiori (rime 242)
|
|
Final
|
G
|
|
Key sig.
|
♮
|
|
Clefs
|
G2, G2, C3
|
|
|
Pitchscape
play
|
|
ID
|
Trm0243a
|
|
Composer
|
Eremita, Giulio / 1589
|
|
Title
|
Fuggìa di poggio in poggio (rime 243)
|
|
Final
|
D
|
|
Key sig.
|
♮
|
|
Clefs
|
G2, G2, C2, C3, F3
|
|
|
Pitchscape
play
|
|
ID
|
Trm0244a
|
|
Composer
|
Virchi, Paolo / 1584
|
|
Title
|
Qual cervo errando suole (rime 244)
|
|
Final
|
G
|
|
Key sig.
|
♭
|
|
Clefs
|
G2, G2, C2, C3, F3
|
|
|
Pitchscape
play
|
|
ID
|
Trm0246a
|
|
Composer
|
Marenzio, Luca / 1595
|
|
Title
|
Al lume delle stelle (rime 246)
|
|
Final
|
A
|
|
Key sig.
|
♮
|
|
Clefs
|
G2, C2, C3, C3, F3
|
|
|
Pitchscape
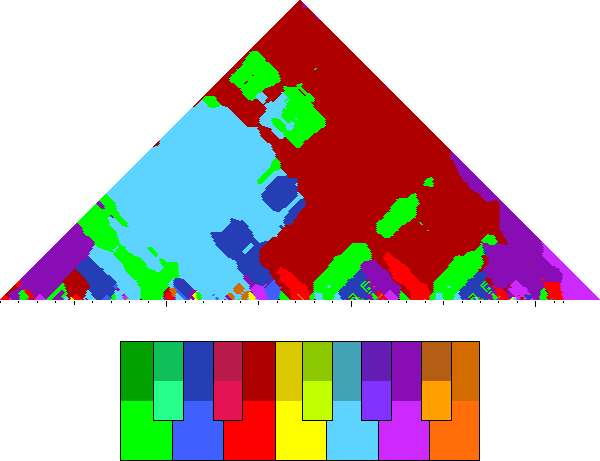
play
|
|
ID
|
Trm0247a
|
|
Composer
|
Marenzio, Luca / 1584
|
|
Title
|
Io vidi già sotto l'ardente sole (rime 247)
|
|
Final
|
G
|
|
Key sig.
|
♭
|
|
Clefs
|
C1, C3, C4, C4, C4, F4
|
|
|
Pitchscape
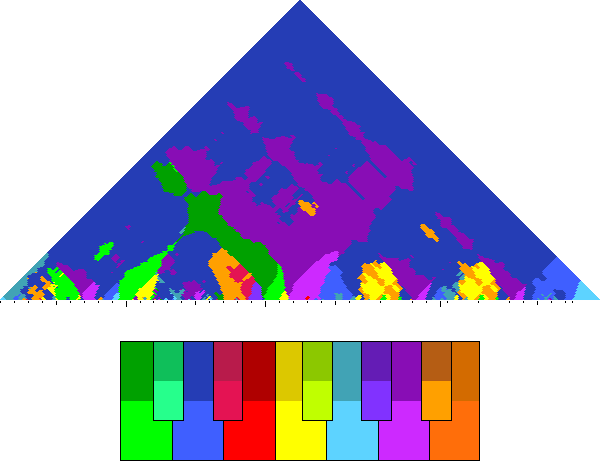
play
|
|
ID
|
Trm0248a
|
|
Composer
|
Marenzio, Luca / 1584
|
|
Title
|
Vita de la mia vita (rime 248)
|
|
Final
|
F
|
|
Key sig.
|
♭
|
|
Clefs
|
C1, C1, C3, C4, C4, F4
|
|
|
Pitchscape
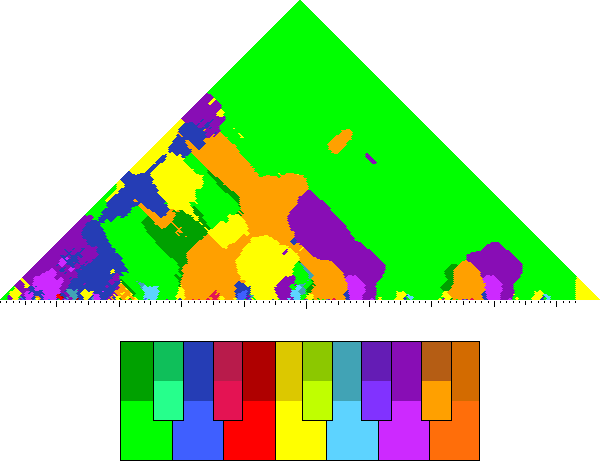
play
|
|
ID
|
Trm0248d
|
|
Composer
|
Genvino, Francesco / 1605
|
|
Title
|
Vita de la mia vita (rime 248)
|
|
Final
|
D
|
|
Key sig.
|
♮
|
|
Clefs
|
G2, C2, C3, C3, F3
|
|
|
Pitchscape
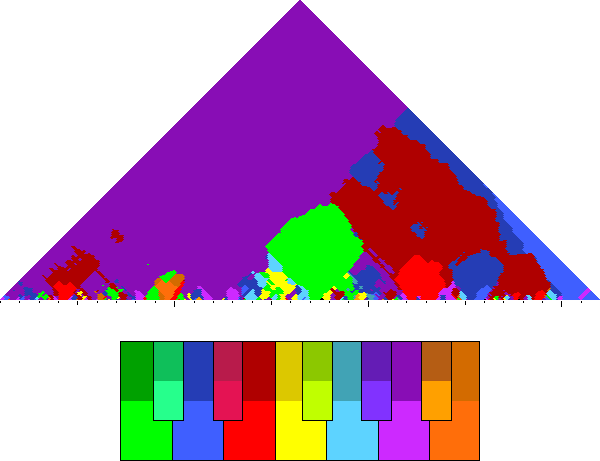
play
|
|
ID
|
Trm0255a
|
|
Composer
|
Giovannelli, Ruggiero / 1599
|
|
Title
|
Mentre in grembo a la madre Amore un giorno (rime 255)
|
|
Final
|
(C)F
|
|
Key sig.
|
♭
|
|
Clefs
|
C1, C1, C3, C4, F4
|
|
|
Pitchscape
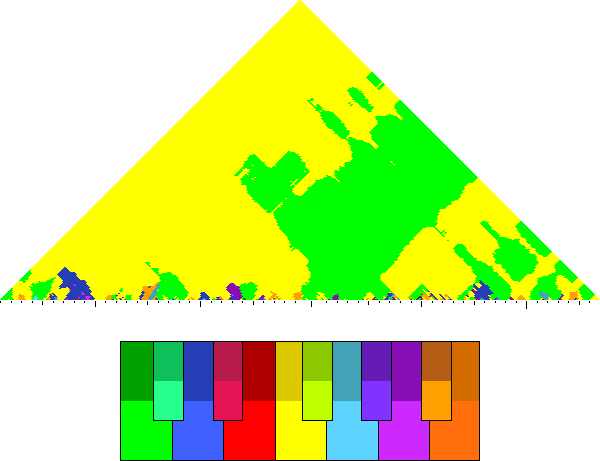
play
|
|
ID
|
Trm0257a
|
|
Composer
|
Monte, Filippo di / 1588
|
|
Title
|
Ardi, Amor, se ti piace (rime 257)
|
|
Final
|
E
|
|
Key sig.
|
♮
|
|
Clefs
|
C1, C1, C3, C4, F4
|
|
|
Pitchscape
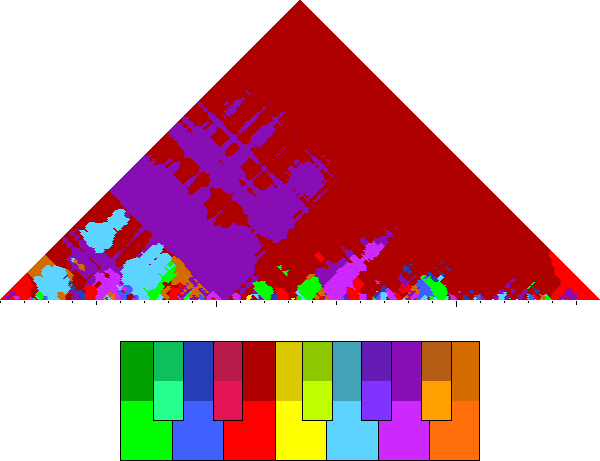
play
|
|
ID
|
Trm0261b
|
|
Composer
|
Macque, Giovanni de / 1610
|
|
Title
|
Mentre volgea il mio sole (rime 261)
|
|
Final
|
F
|
|
Key sig.
|
♭
|
|
Clefs
|
C1, C3, C4, F4
|
|
|
Pitchscape
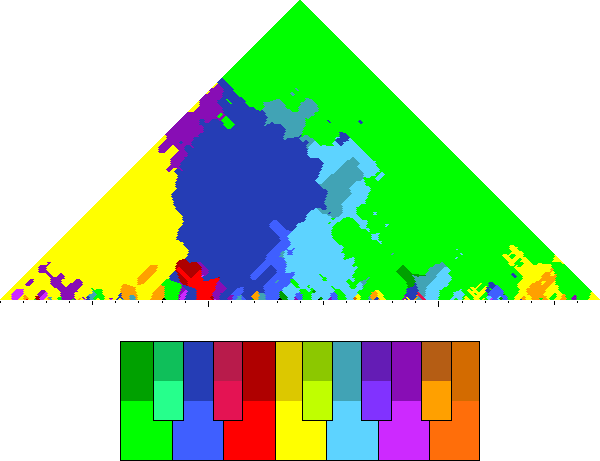
play
|
|
ID
|
Trm0265a
|
|
Composer
|
Hassler, Hans Leo / 1596
|
|
Title
|
Mentre la donna mia cangiando aspetto (rime 265)
|
|
Final
|
G
|
|
Key sig.
|
♭
|
|
Clefs
|
G2, G2, C2, C2, C3, F3
|
|
|
Pitchscape
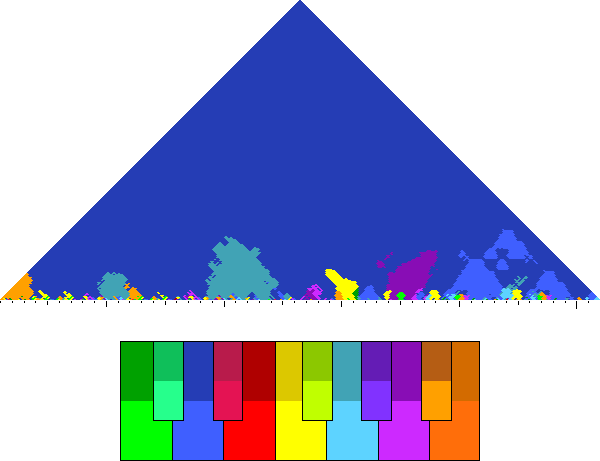
play
|
|
ID
|
Trm0267a
|
|
Composer
|
Zenaro, Giulio / 1589
|
|
Title
|
Bella non è costei (rime 267)
|
|
Final
|
G
|
|
Key sig.
|
♮
|
|
Clefs
|
G2, C2, C3
|
|
|
Pitchscape
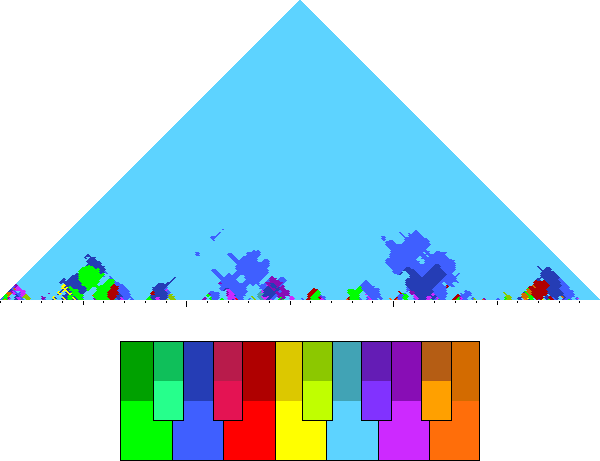
play
|
|
ID
|
Trm0272b
|
|
Composer
|
Gastoldi, Giovanni Giacomo / 1588
|
|
Title
|
Occhi leggiadri e belli,/Nel vostro dolce nero (rime 272)
|
|
Final
|
C
|
|
Key sig.
|
♮
|
|
Clefs
|
G2, G2, C2, C3, F3
|
|
|
Pitchscape
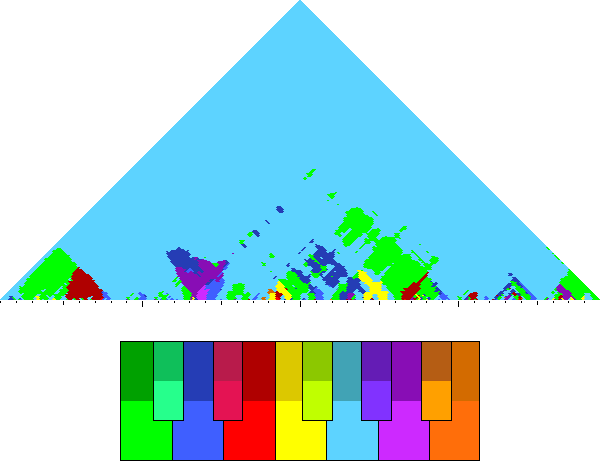
play
|
|
ID
|
Trm0275a
|
|
Composer
|
Recalchi, Giovanni Battista / 1588
|
|
Title
|
O via più bianca e fredda (rime 275)
|
|
Final
|
D
|
|
Key sig.
|
♮
|
|
Clefs
|
C1, C3, C4, C4, F4
|
|
|
Pitchscape
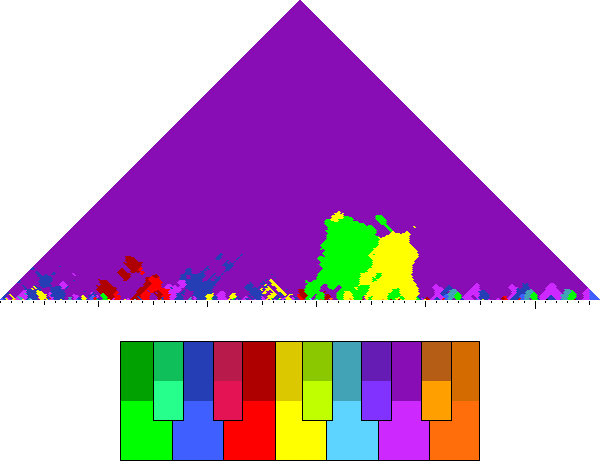
play
|
|
ID
|
Trm0276a
|
|
Composer
|
Bacchini, Giovanni Maria / 1588
|
|
Title
|
Più che Dïana è bella e più mi piace (rime 276)
|
|
Final
|
G
|
|
Key sig.
|
♭
|
|
Clefs
|
G2, C2, C3, C3, F3
|
|
|
Pitchscape
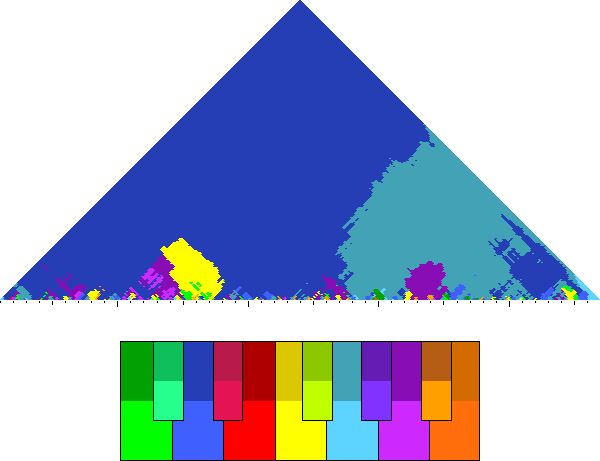
play
|
|
ID
|
Trm0277a
|
|
Composer
|
Cantino, Paolo / 1588
|
|
Title
|
Perché la mia Dïana, anzi 'l mio sole (rime 277)
|
|
Final
|
A
|
|
Key sig.
|
♮
|
|
Clefs
|
G2, G2, C1, C3, C4
|
|
|
Pitchscape
play
|
|
ID
|
Trm0279a
|
|
Composer
|
Monte, Filippo di / 1591
|
|
Title
|
Al discioglier d'un groppo (rime 279)
|
|
Final
|
A
|
|
Key sig.
|
♮
|
|
Clefs
|
G2, G2, C2, C3, F3
|
|
|
Pitchscape
play
|
|
ID
|
Trm0284c
|
|
Composer
|
Macque, Giovanni de / 1587
|
|
Title
|
Questa vostra pietate (rime 284)
|
|
Final
|
F
|
|
Key sig.
|
♭
|
|
Clefs
|
C1, C3, C4, C4, F4
|
|
|
Pitchscape
play
|
|
ID
|
Trm0288g
|
|
Composer
|
Bozi, Paolo / 1591
|
|
Title
|
Amatemi, ben mio (rime 288)
|
|
Final
|
G
|
|
Key sig.
|
♮
|
|
Clefs
|
G2, G2, C3
|
|
|
Pitchscape
play
|
|
ID
|
Trm0288h
|
|
Composer
|
Marenzio, Luca / 1591
|
|
Title
|
Amatemi, ben mio (rime 288)
|
|
Final
|
D
|
|
Key sig.
|
♮
|
|
Clefs
|
C1, C2, C3, C4, C4, F4
|
|
|
Pitchscape
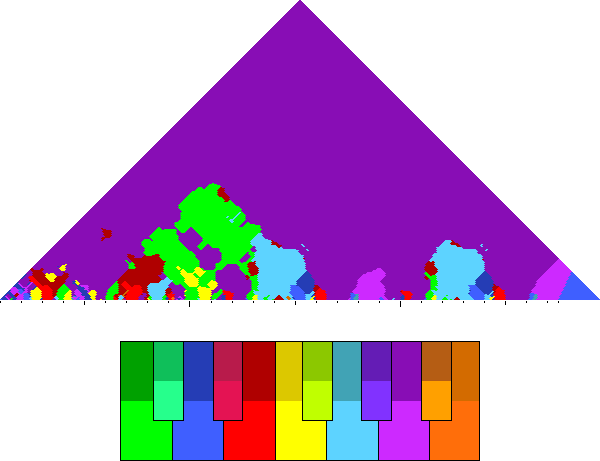
play
|
|
ID
|
Trm0288i
|
|
Composer
|
Montella, Giovan Domenico / 1595
|
|
Title
|
Amatemi, ben mio (rime 288)
|
|
Final
|
(E)A
|
|
Key sig.
|
♮
|
|
Clefs
|
C1, C2, C3, C4, F4
|
|
|
Pitchscape
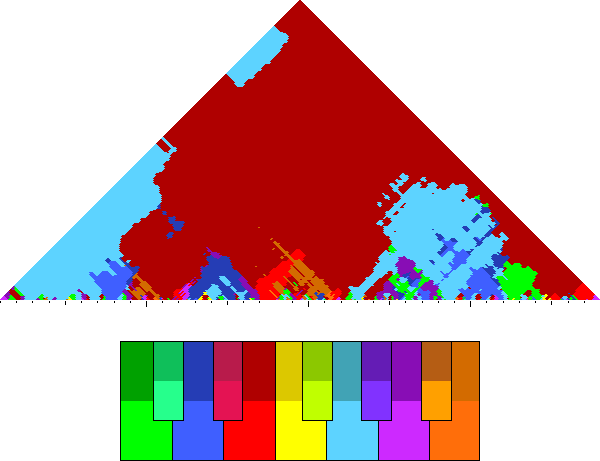
play
|
|
ID
|
Trm0289a
|
|
Composer
|
Bonini, Pietro Andrea / 1591
|
|
Title
|
Già tu volasti quattro volte e sei (rime 289)
|
|
Final
|
C
|
|
Key sig.
|
♮
|
|
Clefs
|
C1, C1, C3, C4, F4
|
|
|
Pitchscape
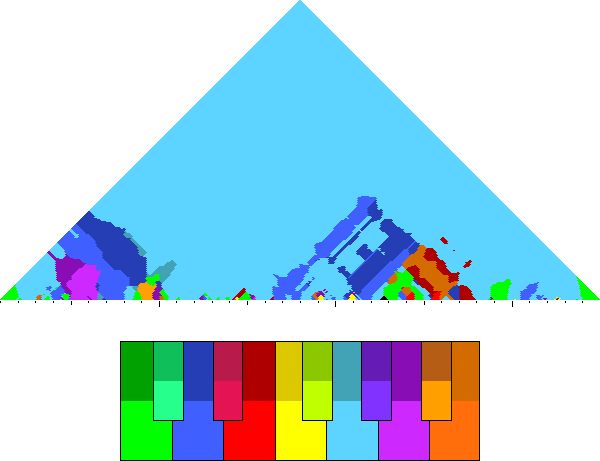
play
|
|
ID
|
Trm0297a
|
|
Composer
|
Vecchi, Orazio / 1580
|
|
Title
|
Se 'l vostro volto è d'un'aria gentile (rime 297)
|
|
Final
|
A
|
|
Key sig.
|
♮
|
|
Clefs
|
G2, G2, C1, C3
|
|
|
Pitchscape
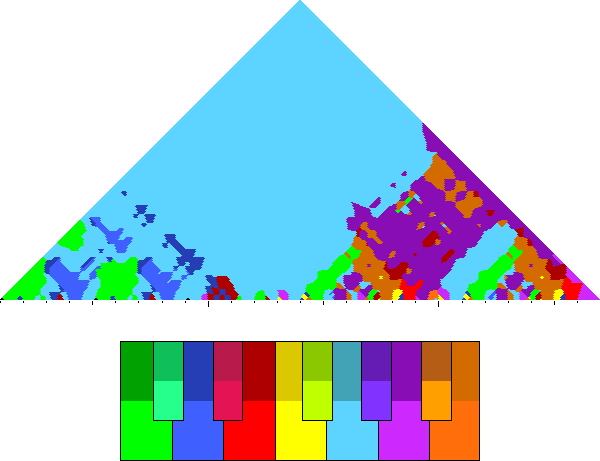
play
|
|
ID
|
Trm0302a
|
|
Composer
|
Felis, Stefano / 1591
|
|
Title
|
Siepe, che gli orti vaghi (rime 302)
|
|
Final
|
A
|
|
Key sig.
|
♮
|
|
Clefs
|
C1, C1, C3, C4, F4
|
|
|
Pitchscape
play
|
|
ID
|
Trm0303a
|
|
Composer
|
Felis, Stefano / 1591
|
|
Title
|
Sarai termine ancora (rime 303)
|
|
Final
|
A
|
|
Key sig.
|
♮
|
|
Clefs
|
C2, C3, C3, C4, F4
|
|
|
Pitchscape
play
|
|
ID
|
Trm0307a
|
|
Composer
|
Zenaro, Giulio / 1589
|
|
Title
|
Non sono in queste rive (rime 307)
|
|
Final
|
G
|
|
Key sig.
|
♮
|
|
Clefs
|
G2, C2, C3
|
|
|
Pitchscape
play
|
|
ID
|
Trm0309a
|
|
Composer
|
Marenzio, Luca / 1595
|
|
Title
|
O verdi selve, o dolci fonti, o rivi (rime 309)
|
|
Final
|
G
|
|
Key sig.
|
♭
|
|
Clefs
|
G2, G2, C1, C2, C3, F3
|
|
|
Pitchscape
play
|
|
ID
|
Trm0315b
|
|
Composer
|
Nenna, Pomponio / 1607
|
|
Title
|
Quella candida mano/Ch'a mezzo il verno i vaghi fiori accinse (rime 315)
|
|
Final
|
A
|
|
Key sig.
|
♮
|
|
Clefs
|
G2, G2, C2, C3, F3
|
|
|
Pitchscape
play
|
|
ID
|
Trm0318a
|
|
Composer
|
Marenzio, Luca / 1585
|
|
Title
|
Sovra un lucido rio (rime 318)
|
|
Final
|
C
|
|
Key sig.
|
♮
|
|
Clefs
|
C1, C3, C3, C4, C4, F4
|
|
|
Pitchscape
play
|
|
ID
|
Trm0318c
|
|
Composer
|
Zenaro, Giulio / 1589
|
|
Title
|
Sovra un lucido rio (rime 318)
|
|
Final
|
G
|
|
Key sig.
|
♭
|
|
Clefs
|
G2, C2, C3
|
|
|
Pitchscape
play
|
|
ID
|
Trm0319a
|
|
Composer
|
Gastoldi, Giovanni Giacomo / 1588
|
|
Title
|
Non può l'angusto loco (rime 319)
|
|
Final
|
A
|
|
Key sig.
|
♮
|
|
Clefs
|
G2, G2, C2, C3, F3
|
|
|
Pitchscape
play
|
|
ID
|
Trm0322a
|
|
Composer
|
D'India, Sigismondo / 1616
|
|
Title
|
Donna, lunge da voi (rime 322)
|
|
Final
|
E
|
|
Key sig.
|
♮
|
|
Clefs
|
C1, C3, C4, C4, F4
|
|
|
Pitchscape
play
|
|
ID
|
Trm0323a
|
|
Composer
|
Garzi, Pietro Francesco / 1629
|
|
Title
|
Lontano dal mio cuore (rime 323)
|
|
Final
|
G
|
|
Key sig.
|
♭
|
|
Clefs
|
C1, C1, F4
|
|
|
Pitchscape
play
|
|
ID
|
Trm0325c
|
|
Composer
|
Salzilli, Crescenzio / 1611
|
|
Title
|
O dolci lagrimette (rime 325)
|
|
Final
|
A
|
|
Key sig.
|
♮
|
|
Clefs
|
G2, C2, C3, C3, F3
|
|
|
Pitchscape
play
|
|
ID
|
Trm0326d
|
|
Composer
|
Dentice, Scipione / 1607
|
|
Title
|
Lunge da gli occhi vostri (rime 326)
|
|
Final
|
A
|
|
Key sig.
|
♮
|
|
Clefs
|
C1, C2, C3, C4, F4
|
|
|
Pitchscape
play
|
|
ID
|
Trm0333a
|
|
Composer
|
Bellasio, Paolo / 1578
|
|
Title
|
Gelo ha Madonna il seno (rime 333)
|
|
Final
|
F
|
|
Key sig.
|
♭
|
|
Clefs
|
C1, C1, C3, C4, F4
|
|
|
Pitchscape
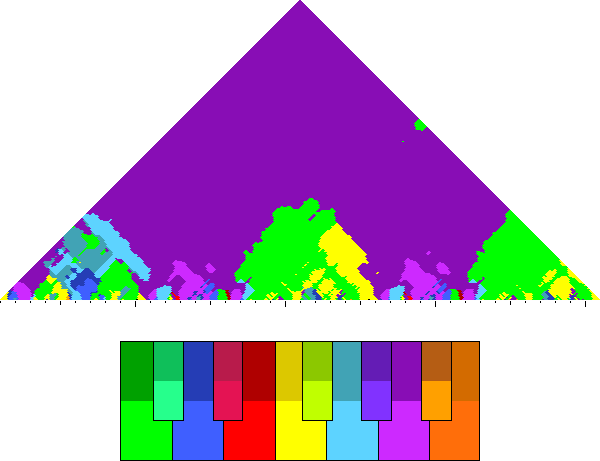
play
|
|
ID
|
Trm0333b
|
|
Composer
|
Merulo, Claudio / 1579
|
|
Title
|
Gelo ha Madonna il seno (rime 333)
|
|
Final
|
A
|
|
Key sig.
|
♮
|
|
Clefs
|
G2, G2, C2, C3, C3, F3
|
|
|
Pitchscape
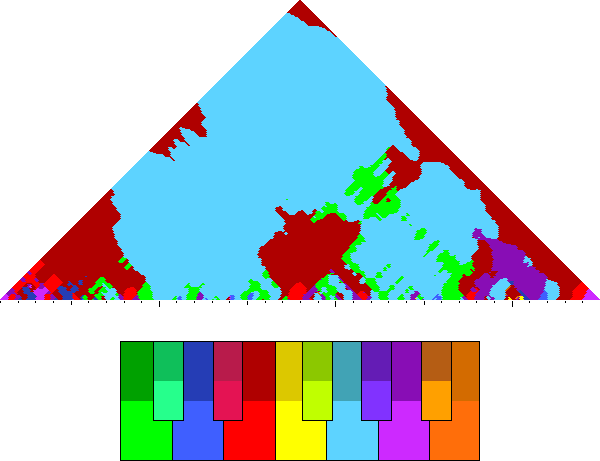
play
|
|
ID
|
Trm0333e
|
|
Composer
|
Macque, Giovanni de / 1587
|
|
Title
|
Gelo ha Madonna il seno (rime 333)
|
|
Final
|
G
|
|
Key sig.
|
♭
|
|
Clefs
|
G2, G2, C2, C3, F3
|
|
|
Pitchscape
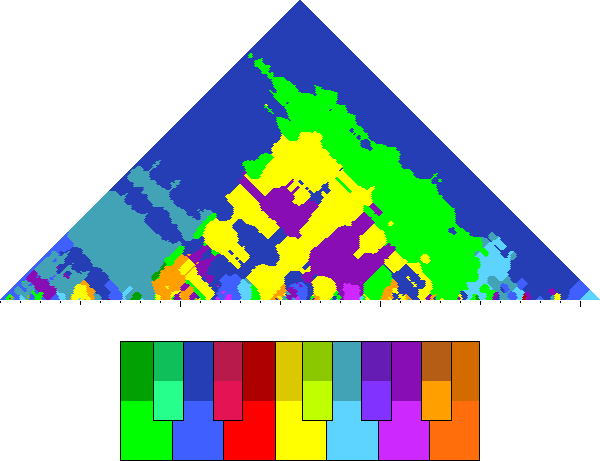
play
|
|
ID
|
Trm0333g
|
|
Composer
|
Monte, Filippo di / 1590
|
|
Title
|
Gelo ha Madonna il seno (rime 333)
|
|
Final
|
D
|
|
Key sig.
|
♮
|
|
Clefs
|
G2, G2, C2, C3, F3
|
|
|
Pitchscape
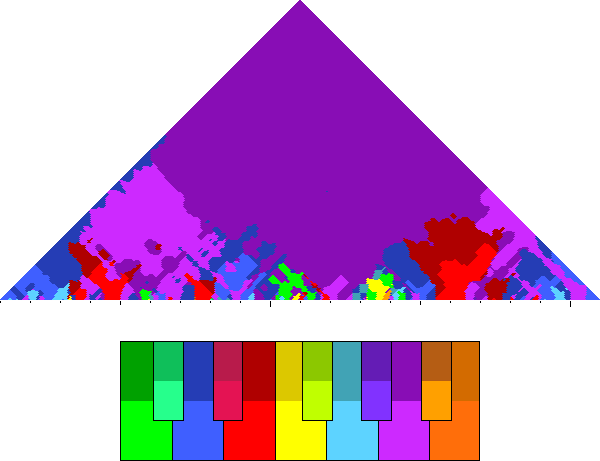
play
|
|
ID
|
Trm0333i
|
|
Composer
|
Gesualdo, Carlo / 1594
|
|
Title
|
Gelo ha Madonna il seno (rime 333)
|
|
Final
|
G
|
|
Key sig.
|
♭
|
|
Clefs
|
C1, C2, C4, C4, F4
|
|
|
Pitchscape
play
|
|
ID
|
Trm0335d
|
|
Composer
|
Zenaro, Giulio / 1589
|
|
Title
|
Voi bramate, ben mio (rime 335)
|
|
Final
|
G
|
|
Key sig.
|
♭
|
|
Clefs
|
G2, C2, C3
|
|
|
Pitchscape
play
|
|
ID
|
Trm0335f
|
|
Composer
|
Fonghetti, Paolo / 1598
|
|
Title
|
Voi bramate, ben mio (rime 335)
|
|
Final
|
A
|
|
Key sig.
|
♮
|
|
Clefs
|
G2, C2
|
|
|
Pitchscape
play
|
|
ID
|
Trm0339b
|
|
Composer
|
Giovannelli, Ruggiero / 1593
|
|
Title
|
Dolcissimi legami (rime 339)
|
|
Final
|
A
|
|
Key sig.
|
♮
|
|
Clefs
|
G2, G2, C2, C3, F3
|
|
|
Pitchscape
play
|
|
ID
|
Trm0341a
|
|
Composer
|
Guami, Giuseppe / 1588
|
|
Title
|
Fuggi, fuggi, dolor, da questo petto (rime 341)
|
|
Final
|
F
|
|
Key sig.
|
♭
|
|
Clefs
|
C1, C3, C4
|
|
|
Pitchscape
play
|
|
ID
|
Trm0343a
|
|
Composer
|
Bellasio, Paolo / 1591
|
|
Title
|
Soavissimo canto (rime 343)
|
|
Final
|
A
|
|
Key sig.
|
♮
|
|
Clefs
|
G2, C1, C3
|
|
|
Pitchscape
play
|
|
ID
|
Trm0345a
|
|
Composer
|
Preti, Alfonso / 1588
|
|
Title
|
Tra mille fior già colti in dolce speco (rime 345)
|
|
Final
|
D
|
|
Key sig.
|
♮
|
|
Clefs
|
C1, C3, C4, C4, F4
|
|
|
Pitchscape
play
|
|
ID
|
Trm0358b
|
|
Composer
|
Cerbello, Giovanni Battista / 1619
|
|
Title
|
Amarilli s'io te miro (rime 358)
|
|
Final
|
G
|
|
Key sig.
|
♭
|
|
Clefs
|
C1, C1, F4
|
|
|
Pitchscape
play
|
|
ID
|
Trm0361a
|
|
Composer
|
Lambardi, Francesco / 1614
|
|
Title
|
Io son la Primavera (rime 361)
|
|
Final
|
F
|
|
Key sig.
|
♭
|
|
Clefs
|
C1, C1, F4
|
|
|
Pitchscape
play
|
|
ID
|
Trm0361b
|
|
Composer
|
Hodemont, Leonard Collet de / 1625
|
|
Title
|
Io son la Primavera (rime 361)
|
|
Final
|
A
|
|
Key sig.
|
♮
|
|
Clefs
|
C3, C4, F4, F4
|
|
|
Pitchscape
play
|
|
ID
|
Trm0361c
|
|
Composer
|
Stefani, Giovanni ? / 1620
|
|
Title
|
Io son la Primavera (rime 361)
|
|
Final
|
F
|
|
Key sig.
|
♭
|
|
Clefs
|
C1, F4
|
|
|
Pitchscape
play
|
|
ID
|
Trm0362a
|
|
Composer
|
Dueto, Antonio / 1586
|
|
Title
|
Questo riposto bel vago boschetto (rime 362)
|
|
Final
|
A
|
|
Key sig.
|
♮
|
|
Clefs
|
C1, C3, C4, F4
|
|
|
Pitchscape
play
|
|
ID
|
Trm0363a
|
|
Composer
|
Hassler, Hans Leo / 1596
|
|
Title
|
Qui dove i sacri e verdeggianti allori (rime 363)
|
|
Final
|
(A)G
|
|
Key sig.
|
♭
|
|
Clefs
|
C1, C2, C3, C4, F4
|
|
|
Pitchscape
play
|
|
ID
|
Trm0366a
|
|
Composer
|
Monte, Filippo di / 1586
|
|
Title
|
Odi, Filli, che tuona; odi che 'n gelo (rime 366)
|
|
Final
|
(C)F
|
|
Key sig.
|
♭
|
|
Clefs
|
C1, C1, C3, C4, F4
|
|
|
Pitchscape
play
|
|
ID
|
Trm0367a
|
|
Composer
|
Luzzaschi, Luzzasco / 1576
|
|
Title
|
Aminta poi ch'a Filli non dispiacque (rime 367)
|
|
Final
|
(E)A
|
|
Key sig.
|
♮
|
|
Clefs
|
G2, C2, C3, C3, C4
|
|
|
Pitchscape
play
|
|
ID
|
Trm0371b
|
|
Composer
|
Bozi, Paolo / 1591
|
|
Title
|
Tre son le Grazie ancelle (rime 371)
|
|
Final
|
G
|
|
Key sig.
|
♮
|
|
Clefs
|
G2, G2, C3
|
|
|
Pitchscape
play
|
|
ID
|
Trm0372b
|
|
Composer
|
Mancini, Curzio / 1605
|
|
Title
|
Bruna sei tu ma bella (rime 372)
|
|
Final
|
D
|
|
Key sig.
|
♭
|
|
Clefs
|
G2, G2, C2, C3, C4
|
|
|
Pitchscape
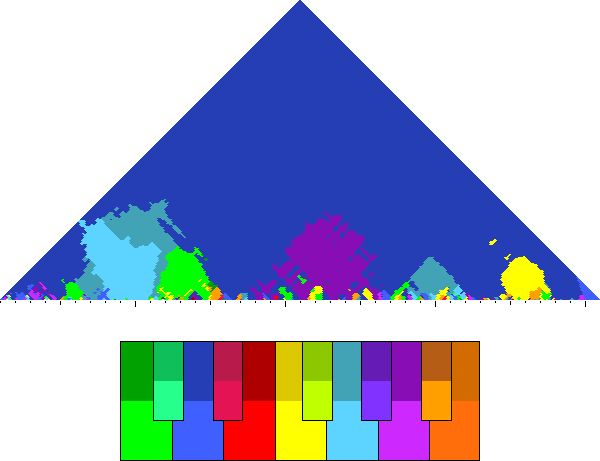
play
|
|
ID
|
Trm0373a
|
|
Composer
|
Vignali, Francesco / 1640
|
|
Title
|
Bella e vaga brunetta (rime 373)
|
|
Final
|
G
|
|
Key sig.
|
♮
|
|
Clefs
|
C1, C1, F4
|
|
|
Pitchscape
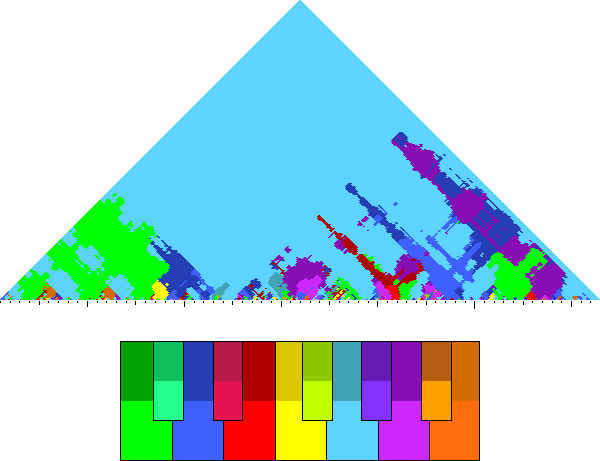
play
|
|
ID
|
Trm0378f
|
|
Composer
|
Marenzio, Luca / 1591
|
|
Title
|
Nel dolce seno de la bella Clori (rime 378)
|
|
Final
|
(E)A
|
|
Key sig.
|
♮
|
|
Clefs
|
C1, C3, C3, C4, C4, F4
|
|
|
Pitchscape
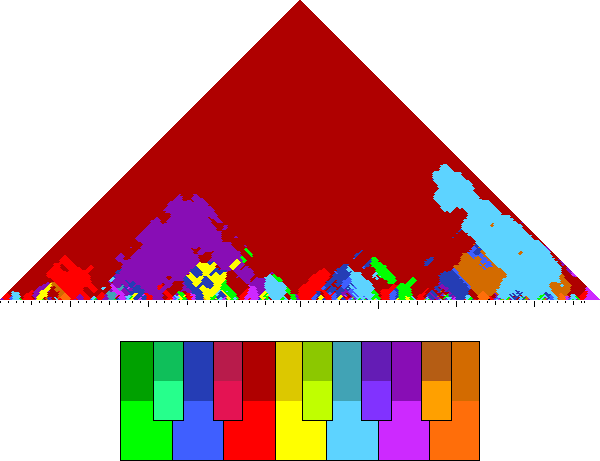
play
|
|
ID
|
Trm0379b
|
|
Composer
|
Gallo, Vincenzo / 1598
|
|
Title
|
Non si levava ancor l'alba novella (rime 379)
|
|
Final
|
(A)A
|
|
Key sig.
|
♭
|
|
Clefs
|
G2, C2, C3, C3, F3
|
|
|
Pitchscape
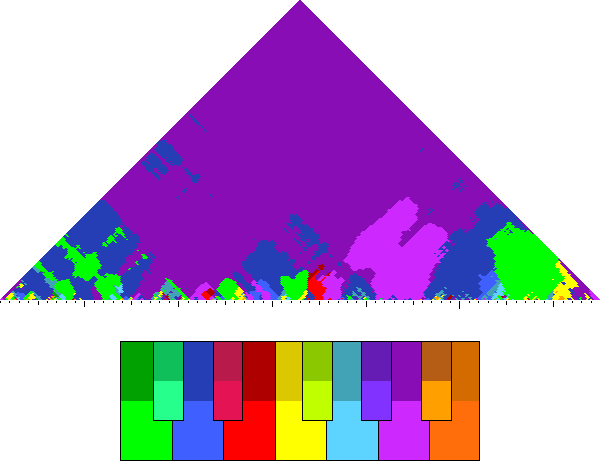
play
|
|
ID
|
Trm0380b
|
|
Composer
|
Nenna, Pomponio / 1607
|
|
Title
|
Viviamo, amianci, o mia gradita Jelle (rime 380)
|
|
Final
|
G
|
|
Key sig.
|
♭
|
|
Clefs
|
C1, C2, C3, C4, F4
|
|
|
Pitchscape
play
|
|
ID
|
Trm0389b
|
|
Composer
|
Monte, Filippo di / 1586
|
|
Title
|
Donna, se ben le chiome ho già ripiene (rime 389)
|
|
Final
|
G
|
|
Key sig.
|
♮
|
|
Clefs
|
C1, C1, C3, C4, F4
|
|
|
Pitchscape
play
|
|
ID
|
Trm0395b
|
|
Composer
|
Marenzio, Luca / 1584
|
|
Title
|
In un bel bosco leggiadre fronde (rime 395)
|
|
Final
|
(E)C
|
|
Key sig.
|
♮
|
|
Clefs
|
C1, C3, C3, C4, C4, F4
|
|
|
Pitchscape
play
|
|
ID
|
Trm0395c
|
|
Composer
|
Monte, Filippo di / 1586
|
|
Title
|
In un bel bosco leggiadre fronde (rime 395)
|
|
Final
|
(G)G
|
|
Key sig.
|
♭
|
|
Clefs
|
G2, G2, C2, C3, C4
|
|
|
Pitchscape
play
|
|
ID
|
Trm0399b
|
|
Composer
|
Marini, Biagio / 1635
|
|
Title
|
O vaga tortorella (rime 399)
|
|
Final
|
F
|
|
Key sig.
|
♭
|
|
Clefs
|
F4, F4
|
|
|
Pitchscape
play
|
|
ID
|
Trm0407a
|
|
Composer
|
Mel, Rinaldo del / 1584
|
|
Title
|
La natura compose (rime 407)
|
|
Final
|
G
|
|
Key sig.
|
♭
|
|
Clefs
|
G2, G2, C2, C3, F3
|
|
|
Pitchscape
play
|
|
ID
|
Trm0408a
|
|
Composer
|
Bozi, Paolo / 1591
|
|
Title
|
Questo tra gli altri fiori (rime 408)
|
|
Final
|
G
|
|
Key sig.
|
♭
|
|
Clefs
|
C1, C1, C4
|
|
|
Pitchscape
play
|
|
ID
|
Trm0418g
|
|
Composer
|
Monte, Filippo di / 1586
|
|
Title
|
Ardi e gela a tua voglia (rime 418)
|
|
Final
|
F
|
|
Key sig.
|
♭
|
|
Clefs
|
G2, C1, C2, C3, F3
|
|
|
Pitchscape
play
|
|
ID
|
Trm0418w
|
|
Composer
|
Fornaci, Giacomo / 1617
|
|
Title
|
Ardi e gela a tua voglia (rime 418)
|
|
Final
|
G
|
|
Key sig.
|
♮
|
|
Clefs
|
C1, F4
|
|
|
Pitchscape
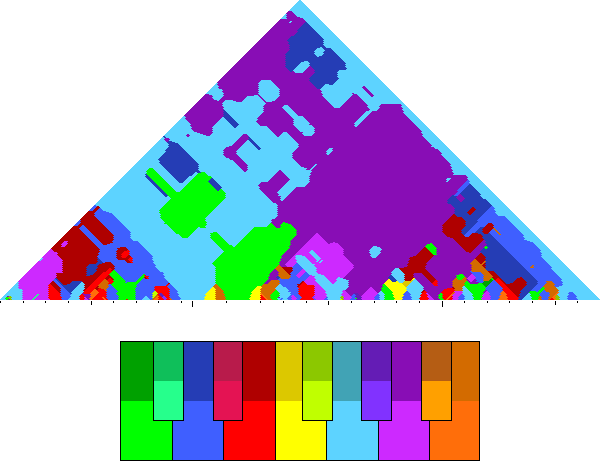
play
|
|
ID
|
Trm0433a
|
|
Composer
|
Marenzio, Luca / 1583
|
|
Title
|
Se tu mi lasci, perfida, tuo danno (rime 433)
|
|
Final
|
G
|
|
Key sig.
|
♮
|
|
Clefs
|
C1, C3, C4, C4, F4
|
|
|
Pitchscape
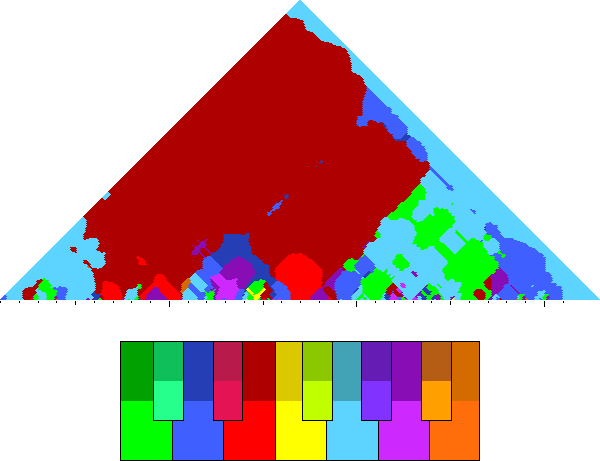
play
|
|
ID
|
Trm0433b
|
|
Composer
|
Stivori, Francesco / 1588
|
|
Title
|
Se tu mi lasci, perfida, tuo danno (rime 433)
|
|
Final
|
A
|
|
Key sig.
|
♮
|
|
Clefs
|
G2, C2, C3
|
|
|
Pitchscape
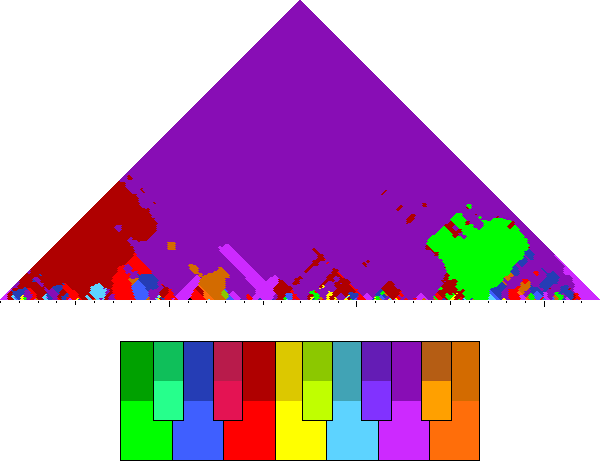
play
|
|
ID
|
Trm0443c
|
|
Composer
|
Bozi, Paolo / 1591
|
|
Title
|
Questa vita è la selva, il verde e l'ombra (rime 443)
|
|
Final
|
A
|
|
Key sig.
|
♮
|
|
Clefs
|
G2, G2, C3
|
|
|
Pitchscape
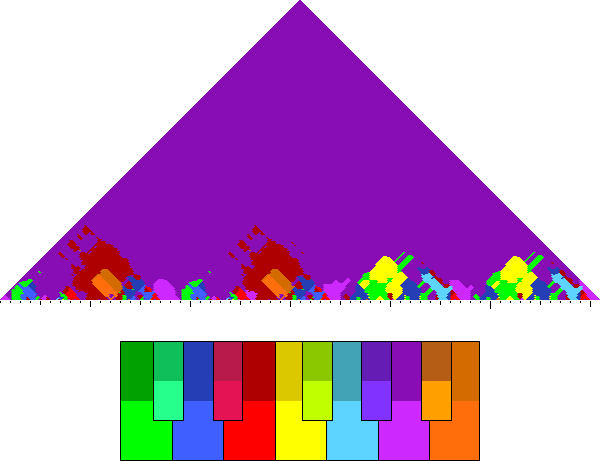
play
|
|
ID
|
Trm0495a
|
|
Composer
|
Gesualdo, Carlo / 1594
|
|
Title
|
Se così dolce è il duolo (rime 495)
|
|
Final
|
(B-)G
|
|
Key sig.
|
♭
|
|
Clefs
|
C1, C2, C4, C4, F4
|
|
|
Pitchscape
play
|
|
ID
|
Trm0541a
|
|
Composer
|
Wert, Giaches de / 1577
|
|
Title
|
Tolse BARBARA gente il pregio a Roma (rime 541)
|
|
Final
|
F
|
|
Key sig.
|
♭
|
|
Clefs
|
G2, C2, C3, C3, F3
|
|
|
Pitchscape
play
|
|
ID
|
Trm0549a
|
|
Composer
|
Isnardi, Paolo / 1577
|
|
Title
|
Quel labbro che le rose han colorito (rime 549)
|
|
Final
|
G
|
|
Key sig.
|
♮
|
|
Clefs
|
G2, C2, C3, C3, F3
|
|
|
Pitchscape
play
|
|
ID
|
Trm0553a
|
|
Composer
|
Marenzio, Luca / 1585
|
|
Title
|
Sul carro de la mente auriga siedi (rime 553)
|
|
Final
|
(F)C
|
|
Key sig.
|
♭
|
|
Clefs
|
G2, C2, C3, F3
|
|
|
Pitchscape
play
|
|
ID
|
Trm0558a
|
|
Composer
|
Meldert, Leonardo / 1575
|
|
Title
|
Facelle son d'immortal luce ardenti (rime 558)
|
|
Final
|
G
|
|
Key sig.
|
♭
|
|
Clefs
|
C1, C3, C4, C4, F4
|
|
|
Pitchscape
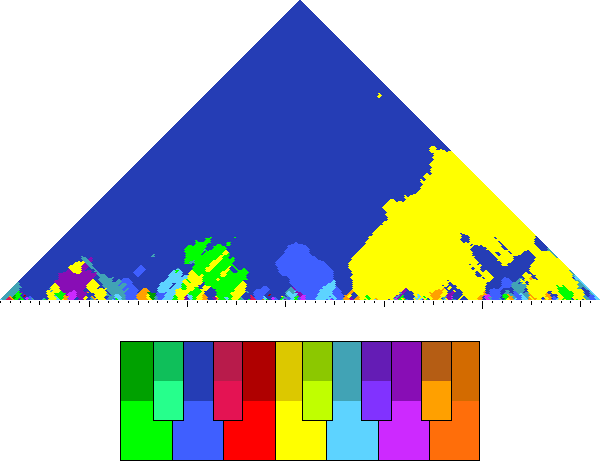
play
|
|
ID
|
Trm0560a
|
|
Composer
|
Vinci, Pietro / 1573
|
|
Title
|
Tarquinia, se rimiri (rime 560)
|
|
Final
|
A
|
|
Key sig.
|
♮
|
|
Clefs
|
C1, C3, C4, C4, F4
|
|
|
Pitchscape

play
|
|
ID
|
Trm0560b
|
|
Composer
|
Bellasio, Paolo / 1578
|
|
Title
|
Tarquinia, se rimiri (rime 560)
|
|
Final
|
D
|
|
Key sig.
|
♮
|
|
Clefs
|
G2, C1, C2, C3, F3
|
|
|
Pitchscape

play
|
|
ID
|
Trm0560c
|
|
Composer
|
Merulo, Claudio / 1579
|
|
Title
|
Tarquinia, se rimiri (rime 560)
|
|
Final
|
G
|
|
Key sig.
|
♭
|
|
Clefs
|
G2, G2, C2, C3, C3, F3
|
|
|
Pitchscape

play
|
|
ID
|
Trm0560f
|
|
Composer
|
Macque, Giovanni de / 1587
|
|
Title
|
Tarquinia, se rimiri (rime 560)
|
|
Final
|
C
|
|
Key sig.
|
♮
|
|
Clefs
|
G2, G2, C2, C3, F4
|
|
|
Pitchscape

play
|
|
ID
|
Trm0560i
|
|
Composer
|
Gesualdo, Carlo / 1594
|
|
Title
|
Tarquinia, se rimiri (rime 560)
|
|
Final
|
A
|
|
Key sig.
|
♮
|
|
Clefs
|
G2, C1, C2, C3, F3
|
|
|
Pitchscape

play
|
|
ID
|
Trm0560m
|
|
Composer
|
Alberti, Innocenzo / 1603
|
|
Title
|
Tarquinia, se rimiri (rime 560)
|
|
Final
|
F
|
|
Key sig.
|
♭
|
|
Clefs
|
G2, C2, C3, F3
|
|
|
Pitchscape

play
|
|
ID
|
Trm0560o
|
|
Composer
|
Spano, Donato Antonio / 1608
|
|
Title
|
Tarquinia, se rimiri (rime 560)
|
|
Final
|
G
|
|
Key sig.
|
♮
|
|
Clefs
|
C2, C3, C4, C4, F4
|
|
|
Pitchscape

play
|
|
ID
|
Trm0571b
|
|
Composer
|
Gesualdo, Carlo / 1594
|
|
Title
|
Se da sì nobil mano (rime 571)
|
|
Final
|
(C)G
|
|
Key sig.
|
♮
|
|
Clefs
|
G2, C1, C2, C3, F3
|
|
|
Pitchscape
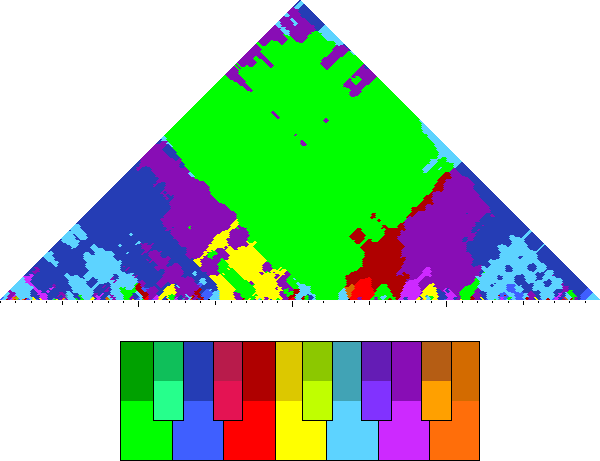
play
|
|
ID
|
Trm0592a
|
|
Composer
|
Monte, Filippo di / 1588
|
|
Title
|
Negli anni acerbi tua purpurea rosa (rime 592)
|
|
Final
|
D
|
|
Key sig.
|
♮
|
|
Clefs
|
C1, C3, C3, C4, F4
|
|
|
Pitchscape
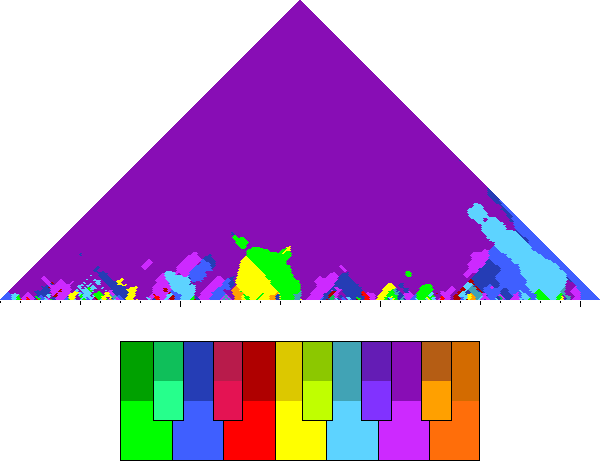
play
|
|
ID
|
Trm0602c
|
|
Composer
|
Monte, Filippo di / 1590
|
|
Title
|
Caro amoroso neo (rime 602)
|
|
Final
|
A
|
|
Key sig.
|
♮
|
|
Clefs
|
G2, G2, C2, C3, F3
|
|
|
Pitchscape
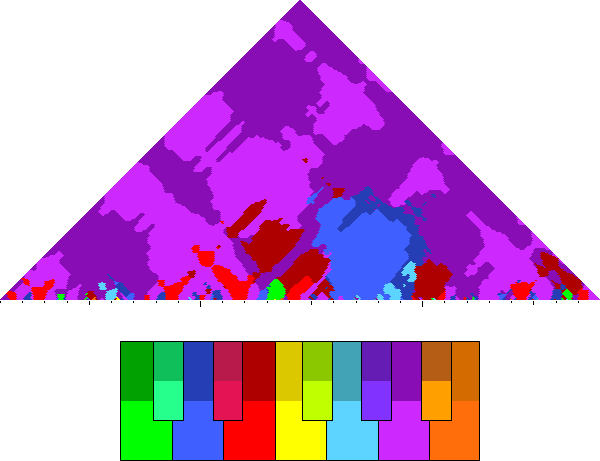
play
|
|
ID
|
Trm0602d
|
|
Composer
|
Effrem, Muzio / 1591
|
|
Title
|
Caro amoroso neo (rime 602)
|
|
Final
|
G
|
|
Key sig.
|
♮
|
|
Clefs
|
G2, C2, C3, C3, F3
|
|
|
Pitchscape
play
|
|
ID
|
Trm0602e
|
|
Composer
|
Gesualdo, Carlo / 1594
|
|
Title
|
Caro amoroso neo (rime 602)
|
|
Final
|
F
|
|
Key sig.
|
♭
|
|
Clefs
|
G2, C1, C2, C3, F3
|
|
|
Pitchscape
play
|
|
ID
|
Trm0611a
|
|
Composer
|
Corfini, Jacopo / 1575
|
|
Title
|
La bella pargoletta (rime 611)
|
|
Final
|
G
|
|
Key sig.
|
♭
|
|
Clefs
|
C1, C1, C3, C4, F3, F4
|
|
|
Pitchscape
play
|
|
ID
|
Trm0611b
|
|
Composer
|
Dragoni, Giovanni Andrea / 1575
|
|
Title
|
La bella pargoletta (rime 611)
|
|
Final
|
G
|
|
Key sig.
|
♭
|
|
Clefs
|
G2, C2, C3, C3, F3
|
|
|
Pitchscape
play
|
|
ID
|
Trm0611c
|
|
Composer
|
Feliciani, Andrea / 1575
|
|
Title
|
La bella pargoletta (rime 611)
|
|
Final
|
G
|
|
Key sig.
|
♭
|
|
Clefs
|
G2, G2, C2, C3, F3
|
|
|
Pitchscape
play
|
|
ID
|
Trm0611d
|
|
Composer
|
Isnardi, Paolo / 1577
|
|
Title
|
La bella pargoletta (rime 611)
|
|
Final
|
G
|
|
Key sig.
|
♮
|
|
Clefs
|
G2, C1, C2, C3, C4
|
|
|
Pitchscape
play
|
|
ID
|
Trm0611m
|
|
Composer
|
Bellaver, Vincenzo / 1587
|
|
Title
|
La bella pargoletta (rime 611)
|
|
Final
|
G
|
|
Key sig.
|
♭
|
|
Clefs
|
G2, C1, C3
|
|
|
Pitchscape
play
|
|
ID
|
Trm0612a
|
|
Composer
|
Porta, Costanzo / 1573
|
|
Title
|
Del puro lume onde i celesti giri (rime 612)
|
|
Final
|
E
|
|
Key sig.
|
♮
|
|
Clefs
|
C1, C3, C4, C4, F4
|
|
|
Pitchscape
play
|
|
ID
|
Trm0614a
|
|
Composer
|
Pordenon, Marco Antonio / 1573
|
|
Title
|
Al vostro dolce azzurro (rime 614)
|
|
Final
|
D
|
|
Key sig.
|
♭
|
|
Clefs
|
C1, C3, C4, C4, F4
|
|
|
Pitchscape
play
|
|
ID
|
Trm0614b
|
|
Composer
|
Felis, Stefano / 1579
|
|
Title
|
Al vostro dolce azzurro (rime 614)
|
|
Final
|
G
|
|
Key sig.
|
♭
|
|
Clefs
|
G2, G2, C2, C3, C3, F3
|
|
|
Pitchscape
play
|
|
ID
|
Trm0614c
|
|
Composer
|
Ingegneri, Marco Antonio / 1579
|
|
Title
|
Al vostro dolce azzurro (rime 614)
|
|
Final
|
F
|
|
Key sig.
|
♭
|
|
Clefs
|
G2, C2, C3, F3
|
|
|
Pitchscape
play
|
|
ID
|
Trm0614h
|
|
Composer
|
Monte, Filippo di / 1590
|
|
Title
|
Al vostro dolce azzurro (rime 614)
|
|
Final
|
D
|
|
Key sig.
|
♭
|
|
Clefs
|
C1, C1, C3, C4, F4
|
|
|
Pitchscape
play
|
|
ID
|
Trm0614j
|
|
Composer
|
Genvino, Francesco / 1605
|
|
Title
|
Al vostro dolce azzurro (rime 614)
|
|
Final
|
C
|
|
Key sig.
|
♮
|
|
Clefs
|
G2, C2, C3, C3, F4
|
|
|
Pitchscape
play
|
|
ID
|
Trm0615b
|
|
Composer
|
Monte, Filippo di / 1586
|
|
Title
|
Al tuo vago pallore (rime 615)
|
|
Final
|
A
|
|
Key sig.
|
♮
|
|
Clefs
|
C1, C1, C3, C4, F4
|
|
|
Pitchscape
play
|
|
ID
|
Trm0707a
|
|
Composer
|
Agostini, Lodovico / 1582
|
|
Title
|
Tra Giove in cielo e 'l mio signor in terra (rime 707)
|
|
Final
|
(C)F
|
|
Key sig.
|
♭
|
|
Clefs
|
C1, C1, C3, C4, C4, F4
|
|
|
Pitchscape
play
|
|
ID
|
Trm0734b
|
|
Composer
|
Dueto, Antonio / 1586
|
|
Title
|
ANGIOLETTA cortese (rime 734)
|
|
Final
|
G
|
|
Key sig.
|
♮
|
|
Clefs
|
C1, C3, C4, F4
|
|
|
Pitchscape
play
|
|
ID
|
Trm0735b
|
|
Composer
|
Gesualdo, Carlo / 1594
|
|
Title
|
Bella ANGIOLETTA da le vaghe piume (rime 735)
|
|
Final
|
C
|
|
Key sig.
|
♮
|
|
Clefs
|
G2, C1, C2, C3, F3
|
|
|
Pitchscape
play
|
|
ID
|
Trm0760a
|
|
Composer
|
Ferrabosco, Alfonso / 1587
|
|
Title
|
Quant'io sono infelice (rime 760)
|
|
Final
|
(D)G
|
|
Key sig.
|
♭
|
|
Clefs
|
C1, C1, C3, C4, F4
|
|
|
Pitchscape
play
|
|
ID
|
Trm0770a
|
|
Composer
|
Verdonck, Cornelis / 1603
|
|
Title
|
Né di feconda conca in ricco mare (rime 770)
|
|
Final
|
(G)C
|
|
Key sig.
|
♮
|
|
Clefs
|
G2, G2, C2, C3, C3, F3
|
|
|
Pitchscape

play
|
|
ID
|
Trm0862a
|
|
Composer
|
Raval, Sebastiano / 1593
|
|
Title
|
La bella e vaga man che le sonore (rime 862)
|
|
Final
|
F
|
|
Key sig.
|
♮
|
|
Clefs
|
G1, C2, C3, C3, C4
|
|
|
Pitchscape
play
|
|
ID
|
Trm0865a
|
|
Composer
|
Monte, Filippo di / 1590
|
|
Title
|
Deh! perché amar chi voi con pari affetto (rime 865)
|
|
Final
|
G
|
|
Key sig.
|
♮
|
|
Clefs
|
G2, G2, G2, C2, C2, C2, C3, C3, F3, F3
|
|
|
Pitchscape
play
|
|
ID
|
Trm0896b
|
|
Composer
|
Felis, Stefano / 1591
|
|
Title
|
Forse è cagion l'aurora (rime 896)
|
|
Final
|
G
|
|
Key sig.
|
♮
|
|
Clefs
|
G2, G2, C2, C3, C4
|
|
|
Pitchscape
play
|
|
ID
|
Trm0901a
|
|
Composer
|
Giovannelli, Ruggiero / 1593
|
|
Title
|
O timida lepretta (rime 901)
|
|
Final
|
G
|
|
Key sig.
|
♮
|
|
Clefs
|
G2, G2, C2, C3, C4
|
|
|
Pitchscape
play
|
|
ID
|
Trm0903a
|
|
Composer
|
Zenaro, Giulio / 1589
|
|
Title
|
O fuggitiva e timidetta fiera (rime 903)
|
|
Final
|
G
|
|
Key sig.
|
♮
|
|
Clefs
|
G2, C2, C3
|
|
|
Pitchscape
play
|
|
ID
|
Trm0929a
|
|
Composer
|
Wert, Giaches de / 1588
|
|
Title
|
Mesola, il Po da' lati e 'l mar a fronte (rime 929)
|
|
Final
|
G
|
|
Key sig.
|
♭
|
|
Clefs
|
C1, C1, C2, C3, C4, F4
|
|
|
Pitchscape
play
|
|
ID
|
Trm0930a
|
|
Composer
|
Wert, Giaches de / 1588
|
|
Title
|
Ha ninfe adorne e belle (rime 930)
|
|
Final
|
(G)C
|
|
Key sig.
|
♮
|
|
Clefs
|
G2, G2, C2, C3, C3, C4
|
|
|
Pitchscape
play
|
|
ID
|
Trm1021a
|
|
Composer
|
Marenzio, Luca / 1595
|
|
Title
|
Là dove sono i pargoletti Amori (rime 1021)
|
|
Final
|
G
|
|
Key sig.
|
♭
|
|
Clefs
|
G2, G2, C1, C2, C3, F3
|
|
|
Pitchscape
play
|
|
ID
|
Trm1022a
|
|
Composer
|
Felis, Stefano / 1591
|
|
Title
|
Voi sete bella, ma fugage e presta (rime 1022)
|
|
Final
|
(G)(G)(G)G
|
|
Key sig.
|
♭
|
|
Clefs
|
C1, C1, C3, C4, F4
|
|
|
Pitchscape
play
|
|
ID
|
Trm1032a
|
|
Composer
|
Giovannelli, Ruggiero / 1592
|
|
Title
|
Tu nascesti di furto (rime 1032)
|
|
Final
|
G
|
|
Key sig.
|
♭
|
|
Clefs
|
C1, C1, C3, C4, F4
|
|
|
Pitchscape
play
|
|
ID
|
Trm1048a
|
|
Composer
|
Guami, Giuseppe / 1588
|
|
Title
|
Queste note io vi dono (rime 1048)
|
|
Final
|
G
|
|
Key sig.
|
♭
|
|
Clefs
|
G2, C1, C4
|
|
|
Pitchscape
play
|
|
ID
|
Trm1049a
|
|
Composer
|
Zenaro, Giulio / 1589
|
|
Title
|
Queste note son nove, e queste Amore (rime 1049)
|
|
Final
|
G
|
|
Key sig.
|
♭
|
|
Clefs
|
G2, C2, C3
|
|
|
Pitchscape
play
|
|
ID
|
Trm1082a
|
|
Composer
|
Philips, Peter / 1603
|
|
Title
|
Deh ferma, ferma il tuo ribello, Amore (rime 1082)
|
|
Final
|
G
|
|
Key sig.
|
♮
|
|
Clefs
|
C1, C1, C3, C4, C4, F4
|
|
|
Pitchscape
play
|
|
ID
|
Trm1203a
|
|
Composer
|
Gherardini, Arcangelo / 1585
|
|
Title
|
Qual cavalier ardito (rime 1203)
|
|
Final
|
(C)F
|
|
Key sig.
|
♭
|
|
Clefs
|
C1, C1, C3, C4, F4
|
|
|
Pitchscape
play
|
|
ID
|
Trm1205b
|
|
Composer
|
Gherardini, Arcangelo / 1585
|
|
Title
|
Tu moristi in quel seno (rime 1205)
|
|
Final
|
F
|
|
Key sig.
|
♭
|
|
Clefs
|
C1, C1, C3, C4, F4
|
|
|
Pitchscape
play
|
|
ID
|
Trm1276a
|
|
Composer
|
Vignali, Francesco / 1640
|
|
Title
|
Tu, bianca e vaga Luna (rime 1276)
|
|
Final
|
G
|
|
Key sig.
|
♮
|
|
Clefs
|
C1, C3, C4, F4, F4
|
|
|
Pitchscape
play
|
|
ID
|
Trm1370a
|
|
Composer
|
Cortellini, Camillo / 1587
|
|
Title
|
Qui dove fan le piante (rime 1370)
|
|
Final
|
(C)F
|
|
Key sig.
|
♭
|
|
Clefs
|
G2, G2, C2, C3, F3
|
|
|
Pitchscape
play
|
|
ID
|
Trm1497a
|
|
Composer
|
Cirullo, Giovanni Antonio / 1598
|
|
Title
|
Ferro in ferir pietoso (rime 1497)
|
|
Final
|
D
|
|
Key sig.
|
♭
|
|
Clefs
|
C1, C1, C3, C4, F4
|
|
|
Pitchscape
play
|
|
ID
|
Trm1637a
|
|
Composer
|
Gastoldi, Giovanni Giacomo / 1587
|
|
Title
|
Anime sante e belle (rime 1637)
|
|
Final
|
G
|
|
Key sig.
|
♭
|
|
Clefs
|
C1, C1, C3, C4, F4
|
|
|
Pitchscape
play
|
|
ID
|
Trm1688b
|
|
Composer
|
Marenzio, Luca / 1584
|
|
Title
|
Padre del cielo, or ch'atra nube il calle (rime 1688)
|
|
Final
|
(C)F
|
|
Key sig.
|
♭
|
|
Clefs
|
C1, C3, C4, C4, F4
|
|
|
Pitchscape
play
|
|
ID
|
Trm1688c
|
|
Composer
|
Dueto, Antonio / 1586
|
|
Title
|
Padre del cielo, or ch'atra nube il calle (rime 1688)
|
|
Final
|
(C)(G)C
|
|
Key sig.
|
♮
|
|
Clefs
|
G2, C2, C3, C4
|
|
|
Pitchscape
play
|
|
ID
|
Trm1688d
|
|
Composer
|
Monte, Filippo di / 1589
|
|
Title
|
Padre del cielo, or ch'atra nube il calle (rime 1688)
|
|
Final
|
E
|
|
Key sig.
|
♮
|
|
Clefs
|
C1, C1, C3, C3, C4, F4
|
|
|
Pitchscape
play
|
|
ID
|
Trm9999a
|
|
Composer
|
Lambardi, Francesco / 1614
|
|
Title
|
Occhi leggiadri e belli/ Or che volete più dal petto mio? (rime 9999)
|
|
Final
|
G
|
|
Key sig.
|
♭
|
|
Clefs
|
C1, C1, F4
|
|
|
Pitchscape
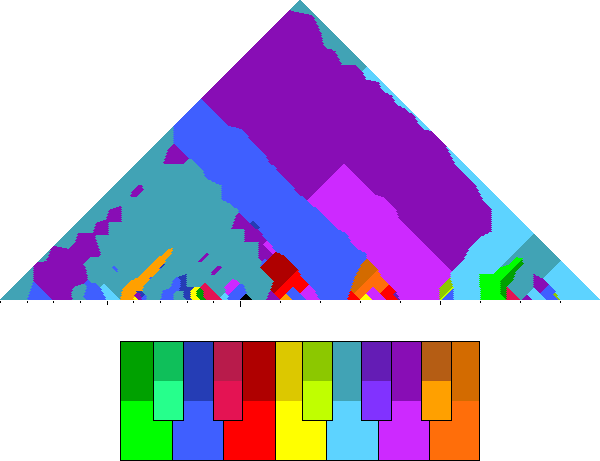
play
|
|
ID
|
Tam1020338b
|
|
Composer
|
Melli, Domenico Maria / 1602
|
|
Title
|
Ho visto al pianto mio
|
|
Final
|
F
|
|
Key sig.
|
♭
|
|
Clefs
|
|
|
|
Pitchscape
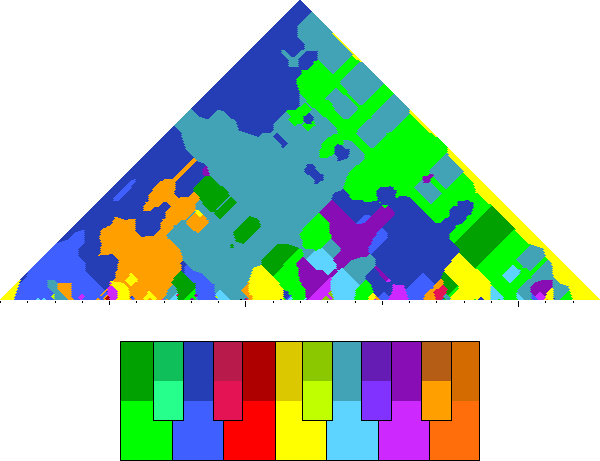
play
|
|
ID
|
Tam1020338c
|
|
Composer
|
Massaino, Tiburtio / 1604
|
|
Title
|
Ho visto al pianto mio
|
|
Final
|
A
|
|
Key sig.
|
♮
|
|
Clefs
|
|
|
|
Pitchscape
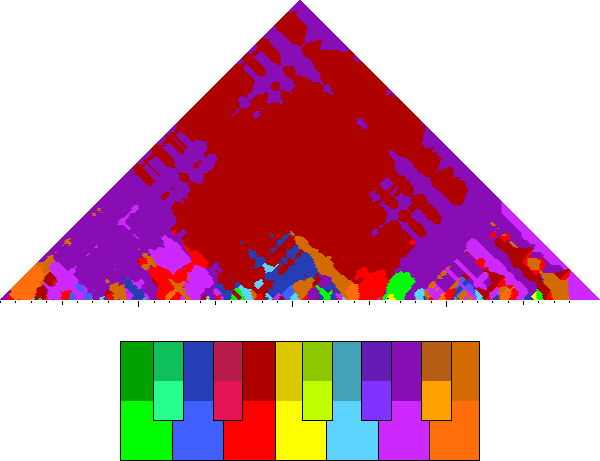
play
|
|
ID
|
Tam1020338d
|
|
Composer
|
Boschetti, Giovanni Boschetto / 1613
|
|
Title
|
Ho visto al pianto mio
|
|
Final
|
D
|
|
Key sig.
|
♮
|
|
Clefs
|
|
|
|
Pitchscape
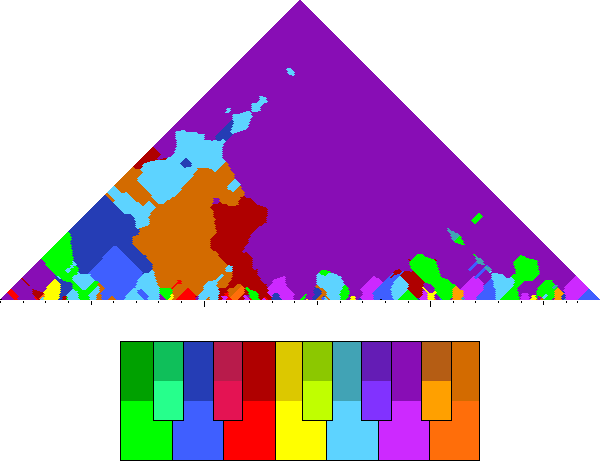
play
|
|
ID
|
Tam1020338e
|
|
Composer
|
Benedetti, Piero / 1617
|
|
Title
|
Ho visto al pianto mio
|
|
Final
|
G
|
|
Key sig.
|
♭
|
|
Clefs
|
|
|
|
Pitchscape
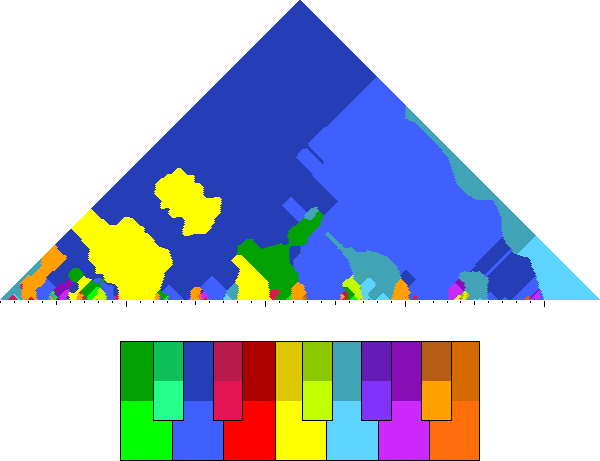
play
|
|
ID
|
Tam2010724a
|
|
Composer
|
Balsamino, Simone / 1594
|
|
Title
|
Picciola è l'ape e fa col picciol morso
|
|
Final
|
G
|
|
Key sig.
|
♮
|
|
Clefs
|
|
|
|
Pitchscape
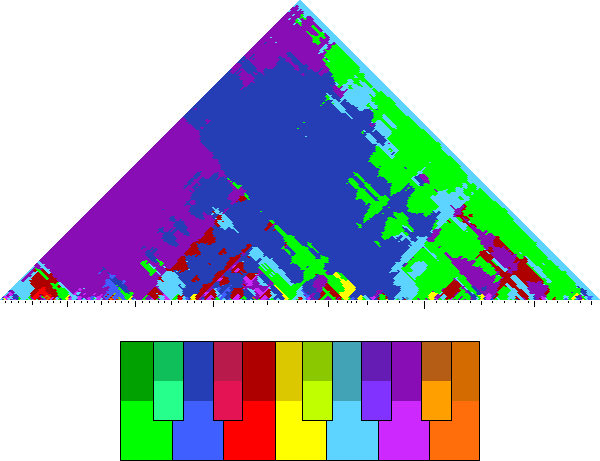
play
|
|
ID
|
Tam2031034a
|
|
Composer
|
Balsamino, Simone / 1594
|
|
Title
|
Vorrò veder ciò che Tirsi avrà fatto
|
|
Final
|
(F)F
|
|
Key sig.
|
♭
|
|
Clefs
|
|
|
|
Pitchscape
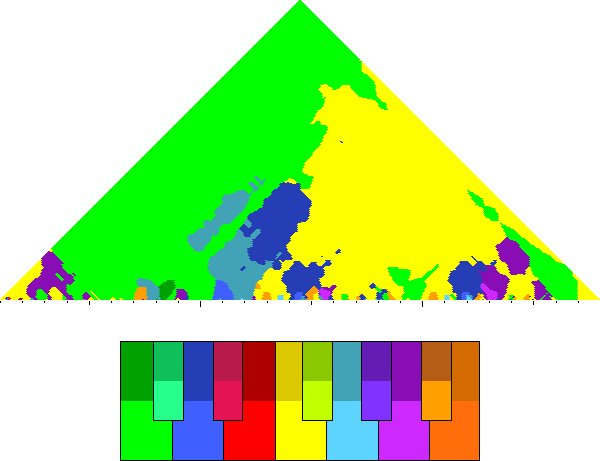
play
|
|
ID
|
Tam2031045a
|
|
Composer
|
Balsamino, Simone / 1594
|
|
Title
|
Nove, Aminta, t'annuncio di conforto
|
|
Final
|
(C)F
|
|
Key sig.
|
♭
|
|
Clefs
|
|
|
|
Pitchscape
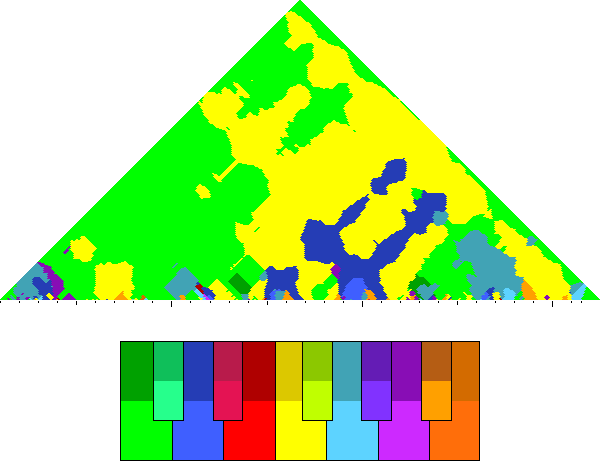
play
|
|
ID
|
Tam2031052a
|
|
Composer
|
Balsamino, Simone / 1594
|
|
Title
|
Qual ardir mi bisogna, e 'ncotra a cui?
|
|
Final
|
(F)F
|
|
Key sig.
|
♭
|
|
Clefs
|
|
|
|
Pitchscape
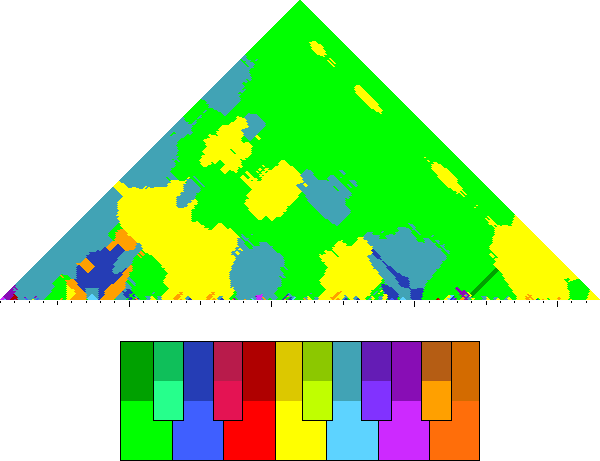
play
|
|
ID
|
Tam2031061a
|
|
Composer
|
Balsamino, Simone / 1594
|
|
Title
|
Bisogna a maggior prova ardir più grande
|
|
Final
|
(C)F
|
|
Key sig.
|
♭
|
|
Clefs
|
|
|
|
Pitchscape
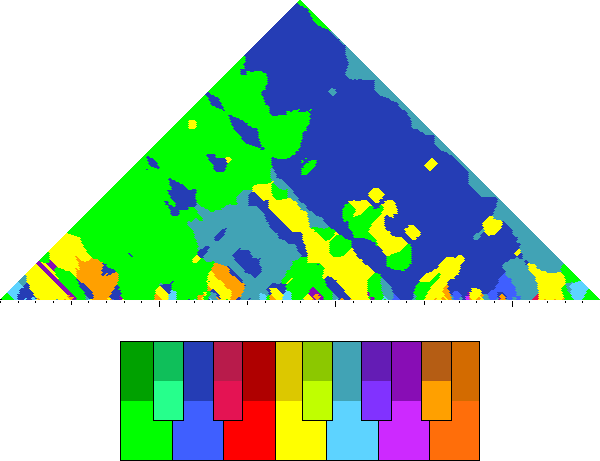
play
|
|
ID
|
Tam2031067a
|
|
Composer
|
Balsamino, Simone / 1594
|
|
Title
|
Orsù scuoprimi il tutto. Odi. Di' tosto
|
|
Final
|
(F)F
|
|
Key sig.
|
♭
|
|
Clefs
|
|
|
|
Pitchscape
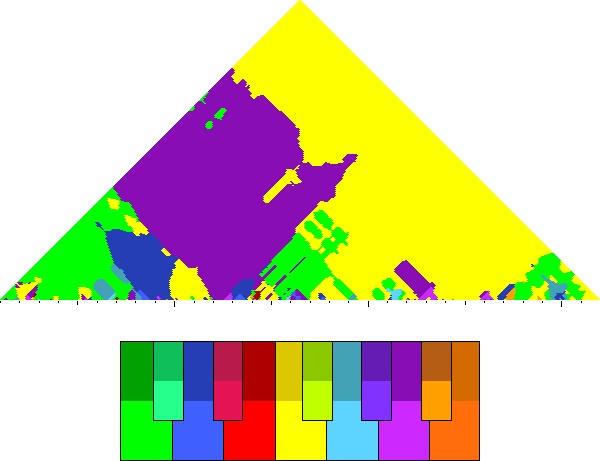
play
|
|
ID
|
Tam2031075a
|
|
Composer
|
Balsamino, Simone / 1594
|
|
Title
|
Dura conclusion, che tutte affosca
|
|
Final
|
(C)F
|
|
Key sig.
|
♭
|
|
Clefs
|
|
|
|
Pitchscape
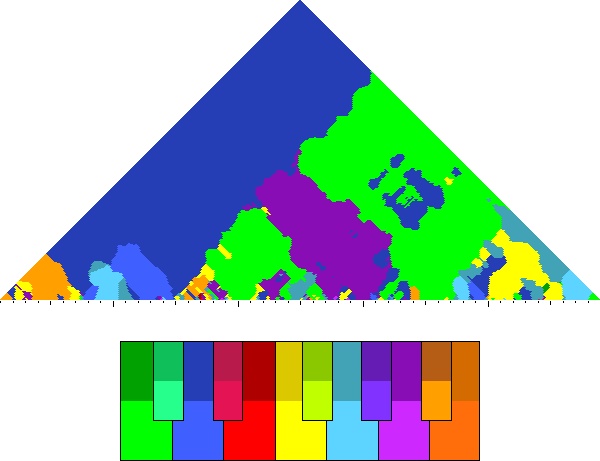
play
|
|
ID
|
Tam2031081a
|
|
Composer
|
Balsamino, Simone / 1594
|
|
Title
|
S'a mio senno farai, sarai felice
|
|
Final
|
(C)F
|
|
Key sig.
|
♭
|
|
Clefs
|
|
|
|
Pitchscape
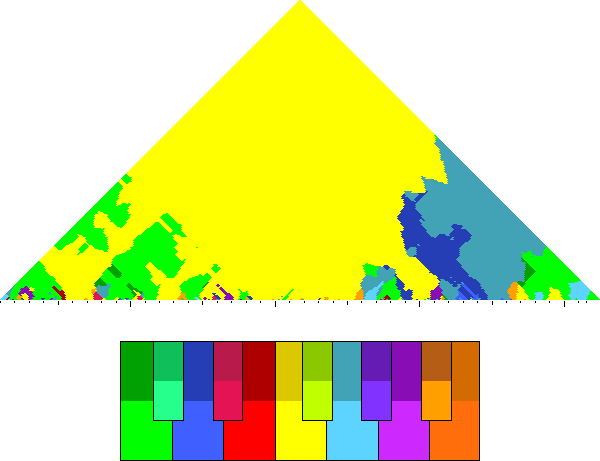
play
|
|
ID
|
Tam2031089a
|
|
Composer
|
Balsamino, Simone / 1594
|
|
Title
|
Non sarà dunque ver ch'in quanto io posso
|
|
Final
|
(F)F
|
|
Key sig.
|
♭
|
|
Clefs
|
|
|
|
Pitchscape
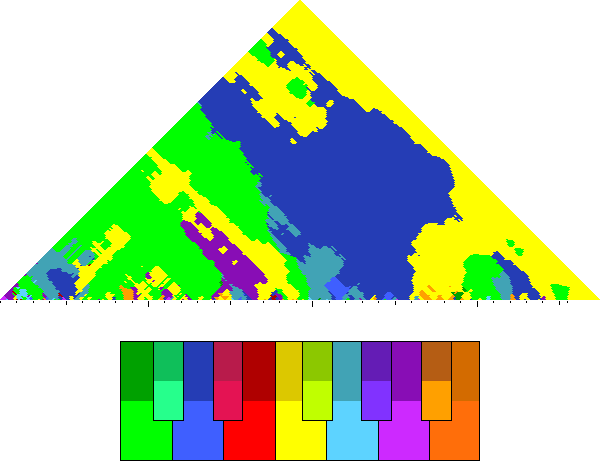
play
|
|
ID
|
Tam2031096a
|
|
Composer
|
Balsamino, Simone / 1594
|
|
Title
|
Dunque tu l'ameresti a suo dispetto
|
|
Final
|
(C)F
|
|
Key sig.
|
♭
|
|
Clefs
|
|
|
|
Pitchscape
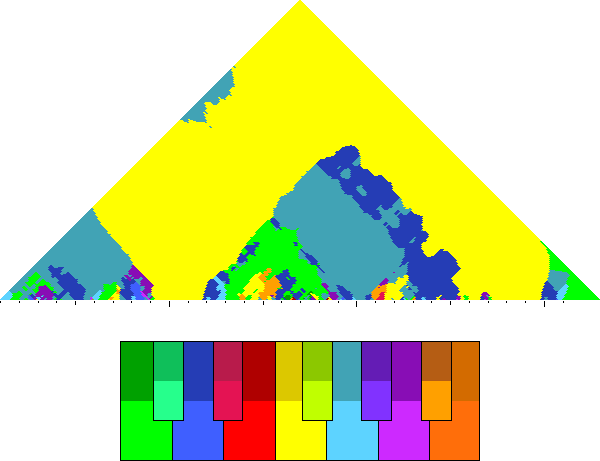
play
|
|
ID
|
Tam2031100a
|
|
Composer
|
Balsamino, Simone / 1594
|
|
Title
|
Perché dunque non osi oltre sua voglia
|
|
Final
|
(B-)F
|
|
Key sig.
|
♭
|
|
Clefs
|
|
|
|
Pitchscape
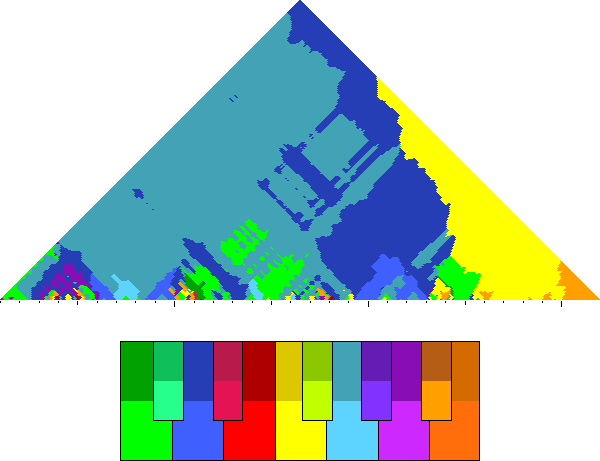
play
|
|
ID
|
Tam2031106a
|
|
Composer
|
Balsamino, Simone / 1594
|
|
Title
|
Già per lungo uso a ragionar d'amore
|
|
Final
|
(F)F
|
|
Key sig.
|
♭
|
|
Clefs
|
|
|
|
Pitchscape
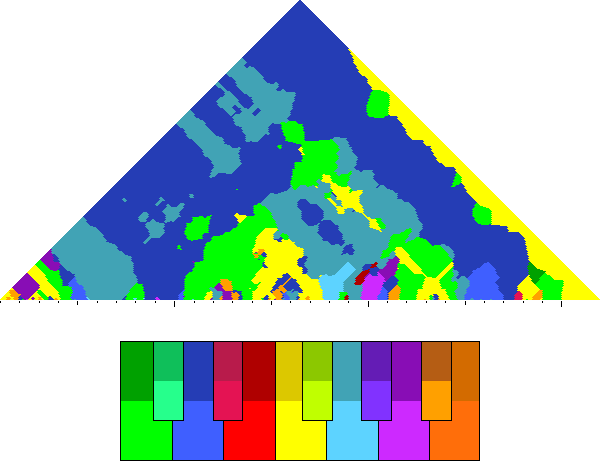
play
|
|
ID
|
Tam2031109a
|
|
Composer
|
Balsamino, Simone / 1594
|
|
Title
|
Dunque andar non vogliamo? Andare io voglio
|
|
Final
|
(C)F
|
|
Key sig.
|
♭
|
|
Clefs
|
|
|
|
Pitchscape
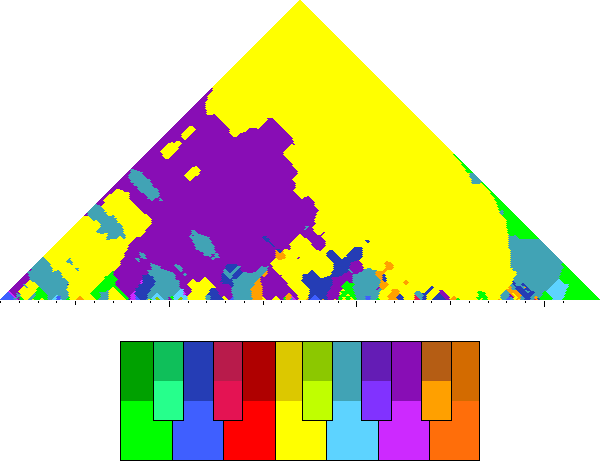
play
|
|
ID
|
Tam2031113a
|
|
Composer
|
Balsamino, Simone / 1594
|
|
Title
|
Credi tu dunque, sciocco, che mai Dafne
|
|
Final
|
(F)F
|
|
Key sig.
|
♭
|
|
Clefs
|
|
|
|
Pitchscape
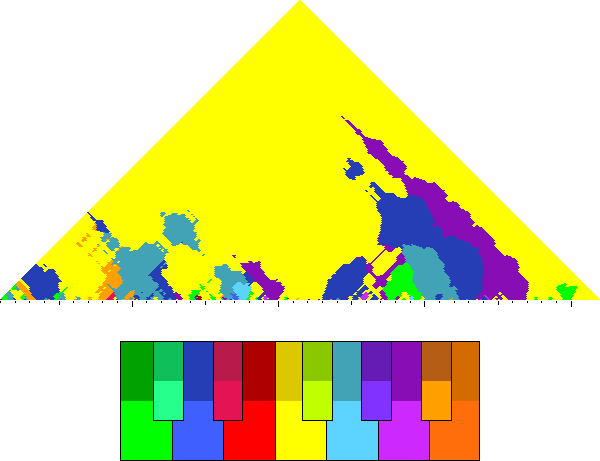
play
|
|
ID
|
Tam2031121a
|
|
Composer
|
Balsamino, Simone / 1594
|
|
Title
|
E s'ella vuol che 'l tuo diletto sia
|
|
Final
|
(F)F
|
|
Key sig.
|
♭
|
|
Clefs
|
|
|
|
Pitchscape
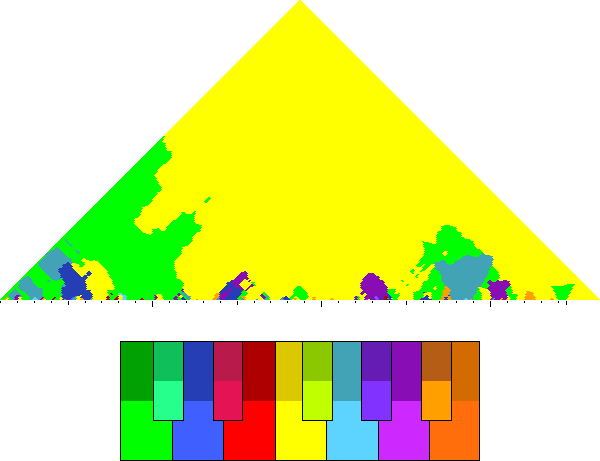
play
|
|
ID
|
Tam2031126a
|
|
Composer
|
Balsamino, Simone / 1594
|
|
Title
|
Ecco tu chiedi pur quella certezza
|
|
Final
|
(A)F
|
|
Key sig.
|
♭
|
|
Clefs
|
|
|
|
Pitchscape
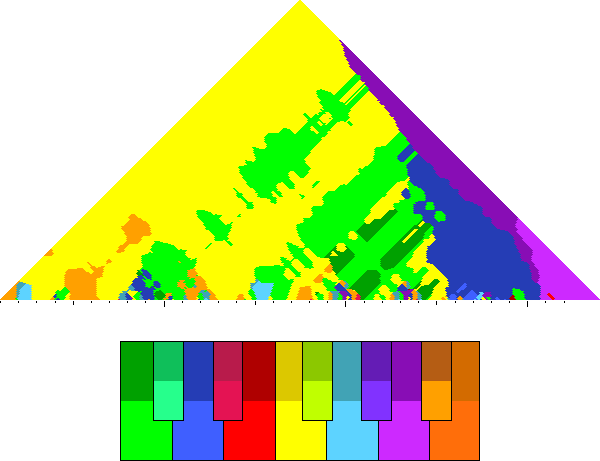
play
|
|
ID
|
Tam2031133a
|
|
Composer
|
Balsamino, Simone / 1594
|
|
Title
|
Tu taci: tu sei vinto. Ora confessa
|
|
Final
|
F
|
|
Key sig.
|
♭
|
|
Clefs
|
|
|
|
Pitchscape
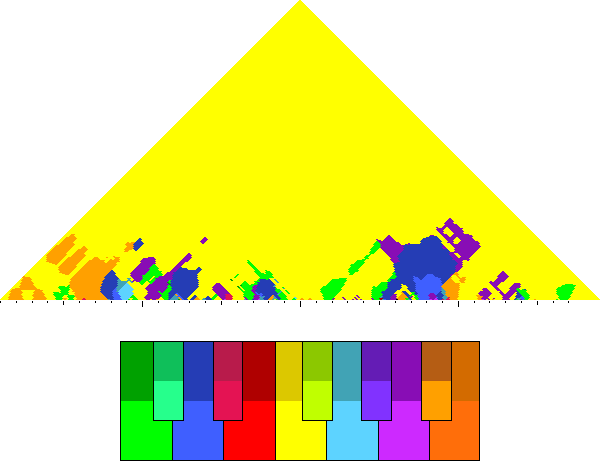
play
|
|
ID
|
Tam3021324a
|
|
Composer
|
D'India, Sigismondo / 1615
|
|
Title
|
Dispietata pietate
|
|
Final
|
A
|
|
Key sig.
|
♮
|
|
Clefs
|
|
|
|
Pitchscape
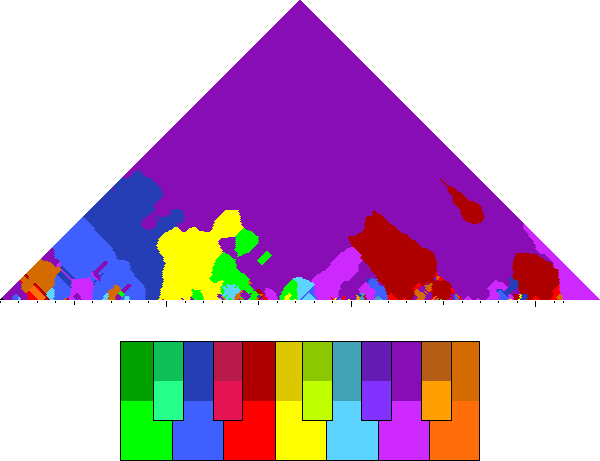
play
|
|
ID
|
Tam3021417b
|
|
Composer
|
Massaino, Tiburtio / 1604
|
|
Title
|
Dolor che sì mi crucii
|
|
Final
|
(A)E
|
|
Key sig.
|
♮
|
|
Clefs
|
|
|
|
Pitchscape
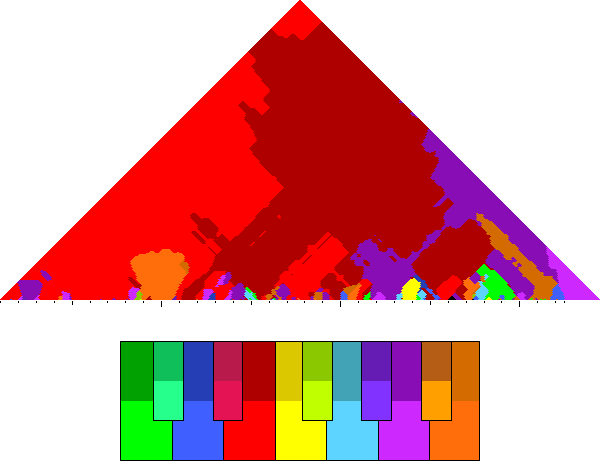
play
|
|
ID
|
Tam3021430b
|
|
Composer
|
Massaino, Tiburtio / 1604
|
|
Title
|
Bello e dolce morir fu certo allora
|
|
Final
|
E
|
|
Key sig.
|
♮
|
|
Clefs
|
|
|
|
Pitchscape
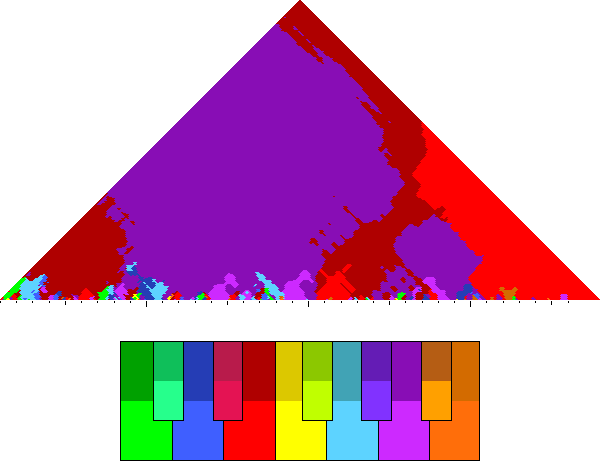
play
|
|
ID
|
Tam4011614a
|
|
Composer
|
Ghizzolo, Giovanni / 1608
|
|
Title
|
Misero Aminta!
|
|
Final
|
(C)C
|
|
Key sig.
|
♮
|
|
Clefs
|
|
|
|
Pitchscape
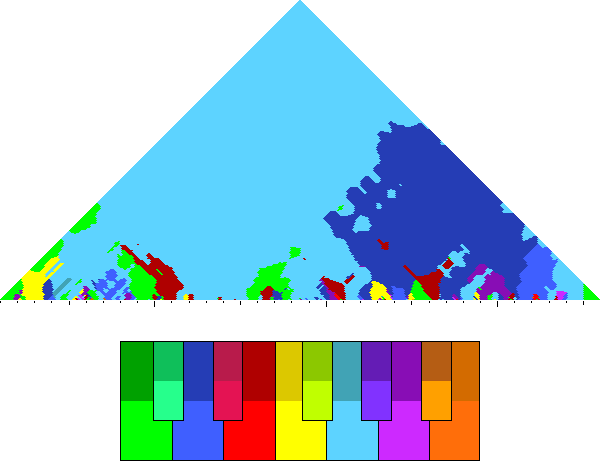
play
|
|
ID
|
Tam4021779a
|
|
Composer
|
Massaino, Tiburtio / 1604
|
|
Title
|
Pastor di che piangete?
|
|
Final
|
E
|
|
Key sig.
|
♮
|
|
Clefs
|
|
|
|
Pitchscape
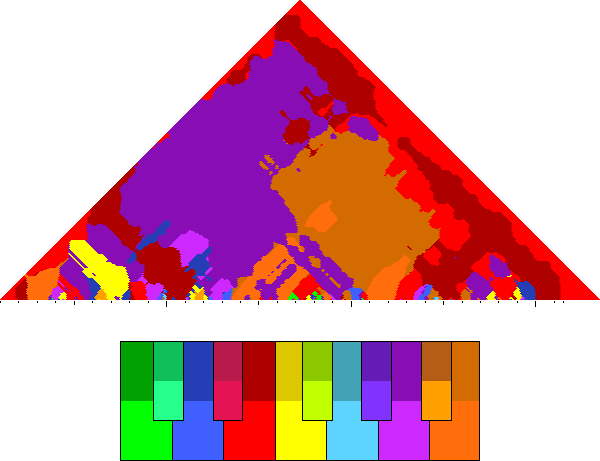
play
|
|
ID
|
Tam4021827a
|
|
Composer
|
Boschetti, Giovanni Boschetto / 1613
|
|
Title
|
Ciò che morte rallenta, Amor restringi
|
|
Final
|
(A)D
|
|
Key sig.
|
♮
|
|
Clefs
|
|
|
|
Pitchscape
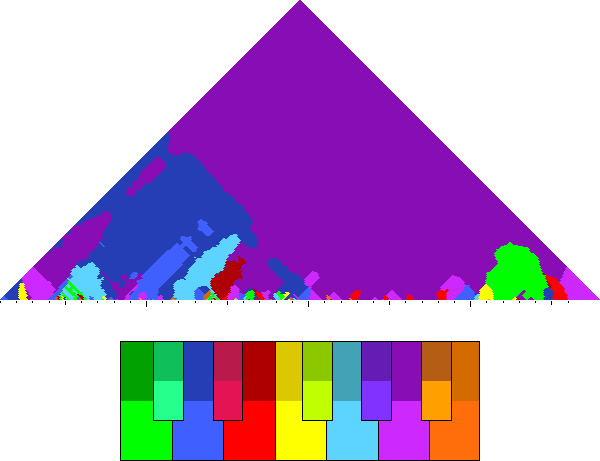
play
|
|
ID
|
Tam4021833a
|
|
Composer
|
Boschetti, Giovanni Boschetto / 1613
|
|
Title
|
Non sono ire la sù: gli umani ingegni
|
|
Final
|
D
|
|
Key sig.
|
♮
|
|
Clefs
|
|
|
|
Pitchscape
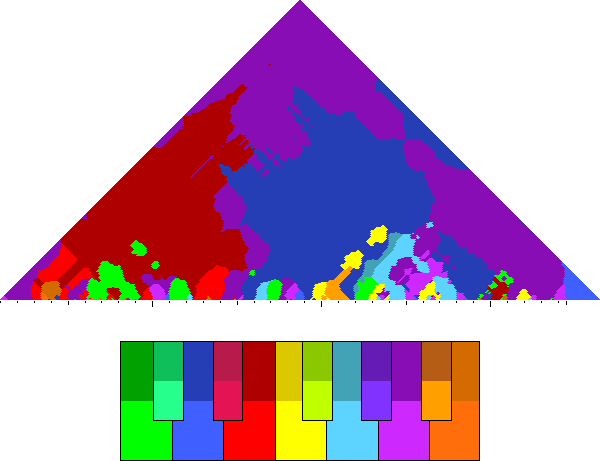
play
|
|
ID
|
Tam5011850a
|
|
Composer
|
Ghizzolo, Giovanni / 1608
|
|
Title
|
Oh fortunato Aminta, oh te felice
|
|
Final
|
F
|
|
Key sig.
|
♭
|
|
Clefs
|
|
|
|
Pitchscape
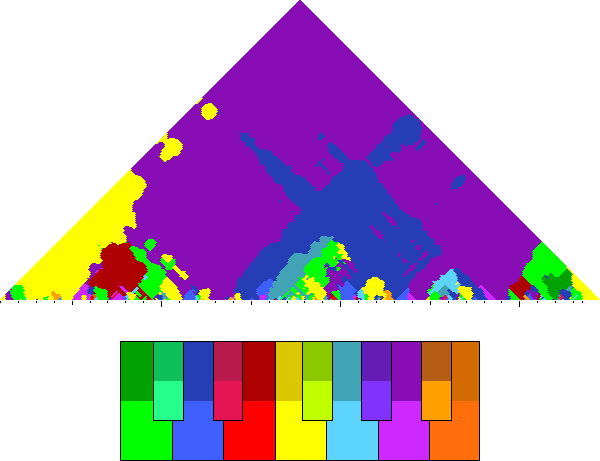
play
|
|
ID
|
Tam5011934a
|
|
Composer
|
Ghizzolo, Giovanni / 1608
|
|
Title
|
Ma come Silvia li riconobbe e vide
|
|
Final
|
C
|
|
Key sig.
|
♮
|
|
Clefs
|
|
|
|
Pitchscape
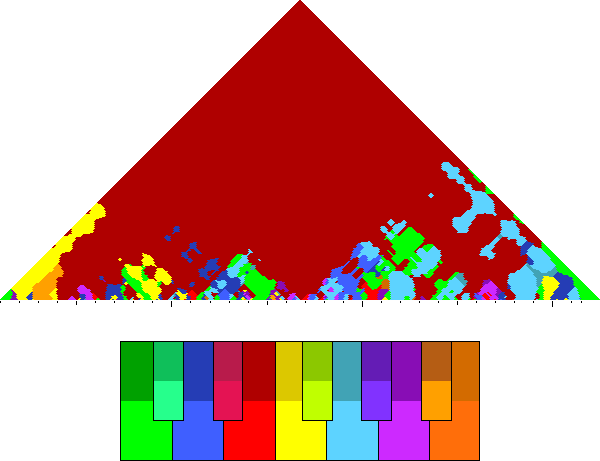
play
|
|
ID
|
Tam5011978a
|
|
Composer
|
Boschetti, Giovanni Boschetto / 1613
|
|
Title
|
Non so se il molto amaro
|
|
Final
|
G
|
|
Key sig.
|
♮
|
|
Clefs
|
|
|
|
Pitchscape
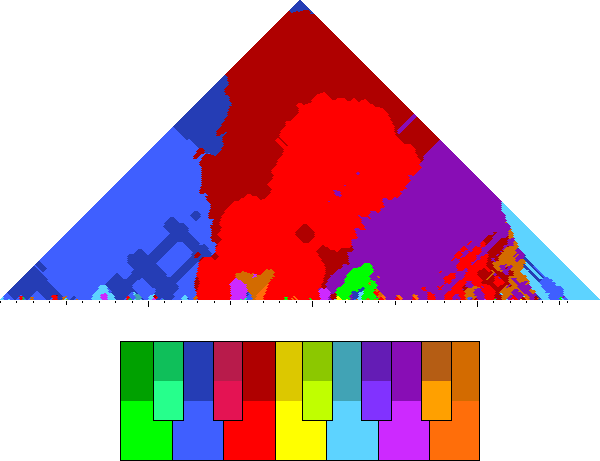
play
|
|
ID
|
Tec1089a
|
|
Composer
|
Coma, Annibale / 1588
|
|
Title
|
Di che cantar degg'io
|
|
Final
|
|
|
Key sig.
|
♮
|
|
Clefs
|
|
|
|
Pitchscape
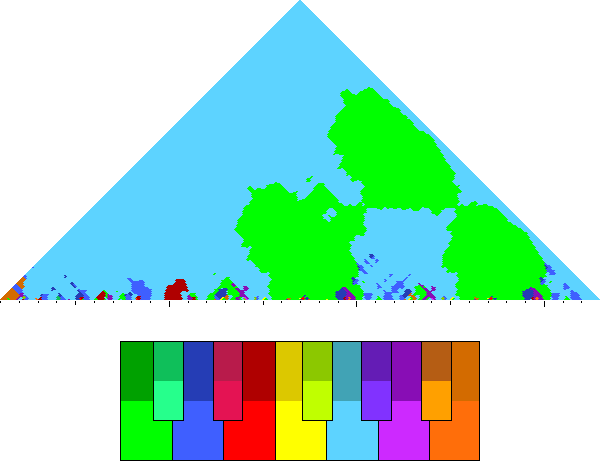
play
|
|
ID
|
Tri5016b
|
|
Composer
|
Stivori, Francesco / 1590
|
|
Title
|
Lasso, dicea, "Perché venisti Amore
|
|
Final
|
D
|
|
Key sig.
|
♭
|
|
Clefs
|
|
|
|
Pitchscape
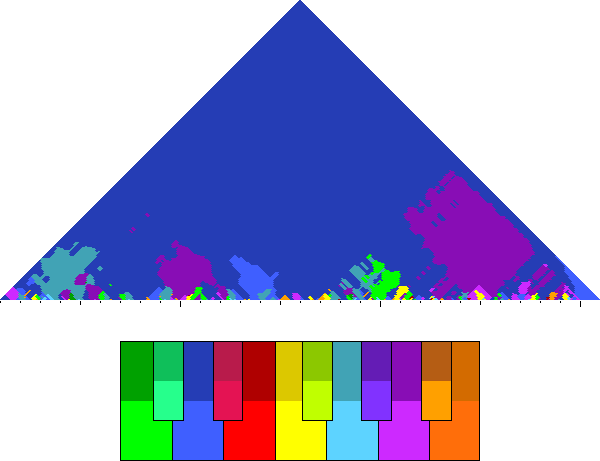
play
|
|
ID
|
Tri5018a
|
|
Composer
|
Felis, Stefano / 1591
|
|
Title
|
Tu perfido signor, tu disleale
|
|
Final
|
A
|
|
Key sig.
|
♮
|
|
Clefs
|
|
|
|
Pitchscape
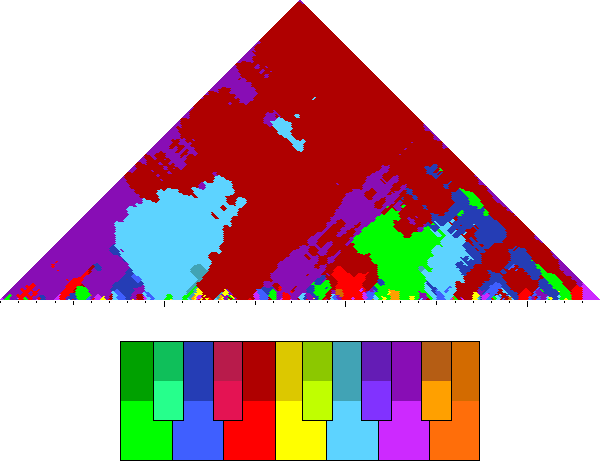
play
|
|
ID
|
Trt0506a
|
|
Composer
|
Personè, Diego / 1628
|
|
Title
|
Ahi lagrime! ahi dolore
|
|
Final
|
G
|
|
Key sig.
|
♭
|
|
Clefs
|
|
|
|
Pitchscape
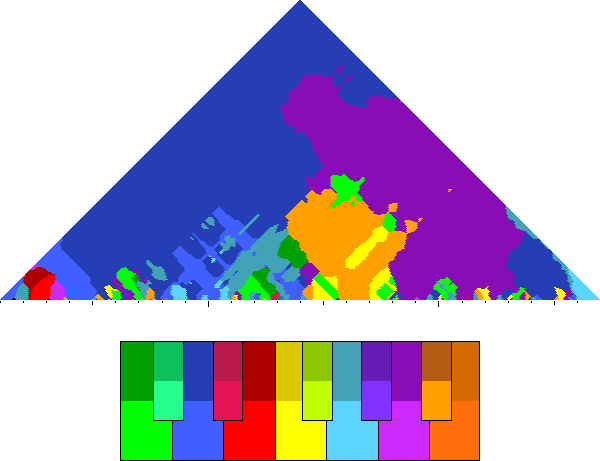
play
|
|
ID
|
Tsg01002a
|
|
Composer
|
Bellanda, Lodovico / 1599
|
|
Title
|
O musa, tu che di caduchi allori
|
|
Final
|
(F)F
|
|
Key sig.
|
♭
|
|
Clefs
|
|
|
|
Pitchscape
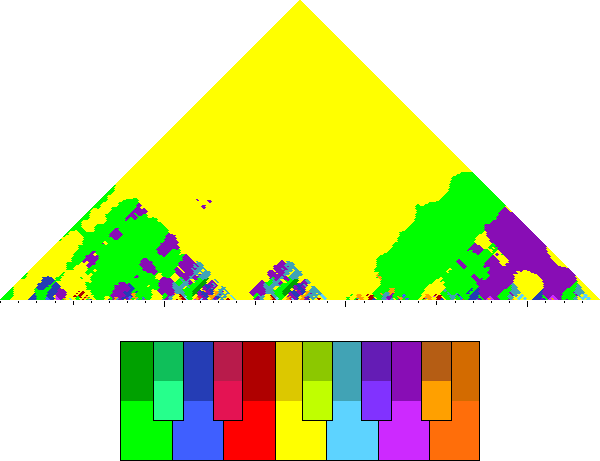
play
|
|
ID
|
Tsg01002b
|
|
Composer
|
Priuli, Giovanni / 1604
|
|
Title
|
O musa, tu che di caduchi allori
|
|
Final
|
(C)F
|
|
Key sig.
|
♭
|
|
Clefs
|
|
|
|
Pitchscape
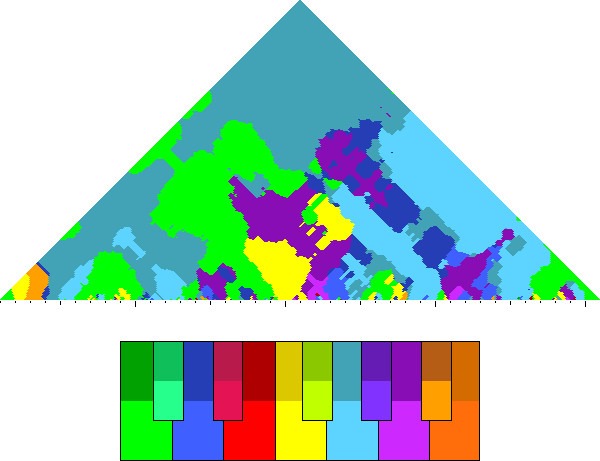
play
|
|
ID
|
Tsg01003a
|
|
Composer
|
Priuli, Giovanni / 1604
|
|
Title
|
Sai che là corre il mondo ove più versi
|
|
Final
|
F
|
|
Key sig.
|
♭
|
|
Clefs
|
|
|
|
Pitchscape
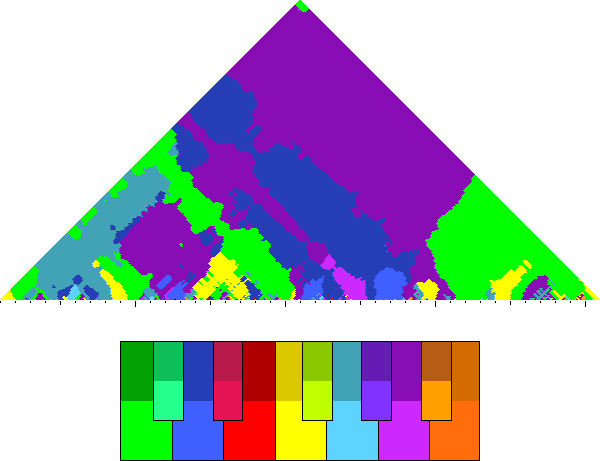
play
|
|
ID
|
Tsg03008a
|
|
Composer
|
Mazzocchi, Domenico / 1640
|
|
Title
|
Dunque, ove tu signor di mille rivi
|
|
Final
|
D
|
|
Key sig.
|
♮
|
|
Clefs
|
|
|
|
Pitchscape
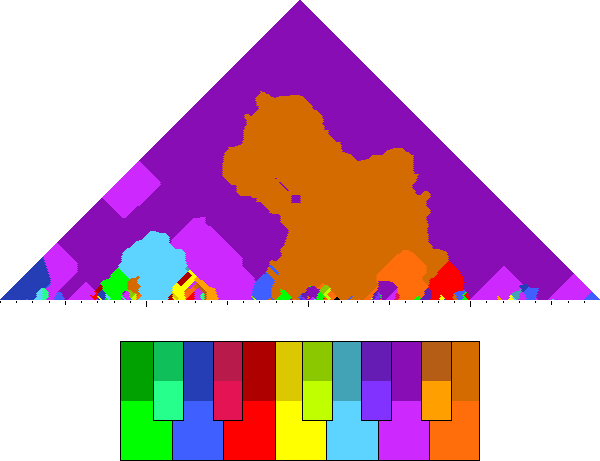
play
|
|
ID
|
Tsg07019b
|
|
Composer
|
D'India, Sigismondo / 1609
|
|
Title
|
Sovente, allor che su gli estivi ardori
|
|
Final
|
(G)G
|
|
Key sig.
|
♭
|
|
Clefs
|
|
|
|
Pitchscape
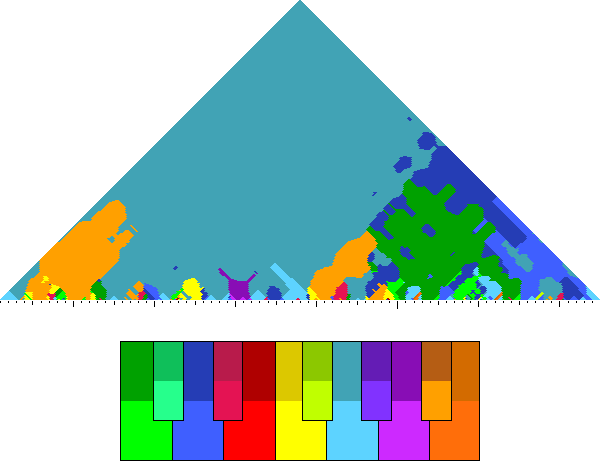
play
|
|
ID
|
Tsg07020b
|
|
Composer
|
D'India, Sigismondo / 1609
|
|
Title
|
Indi dicea piangendo: "In voi serbate
|
|
Final
|
(G)G
|
|
Key sig.
|
♭
|
|
Clefs
|
|
|
|
Pitchscape
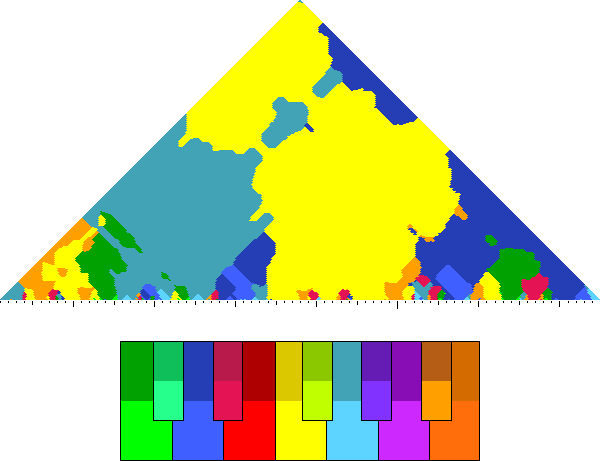
play
|
|
ID
|
Tsg07021a
|
|
Composer
|
D'India, Sigismondo / 1609
|
|
Title
|
Forse avverrà se 'l ciel benigno ascolta
|
|
Final
|
(G)G
|
|
Key sig.
|
♭
|
|
Clefs
|
|
|
|
Pitchscape
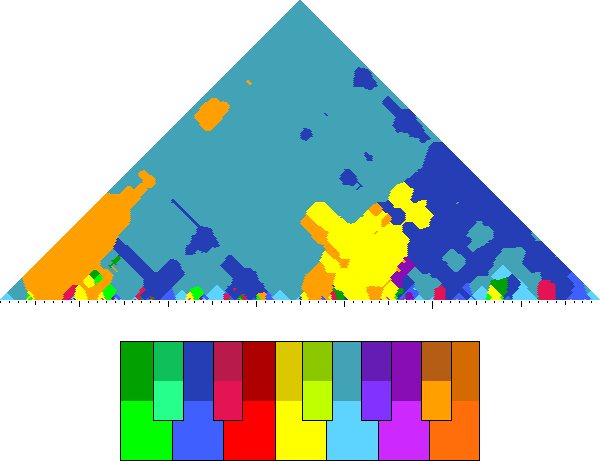
play
|
|
ID
|
Tsg12077a
|
|
Composer
|
Monteverdi, Claudio / 1592
|
|
Title
|
Vivrò fra i miei tormenti e le mie cure
|
|
Final
|
(A)D
|
|
Key sig.
|
♮
|
|
Clefs
|
|
|
|
Pitchscape
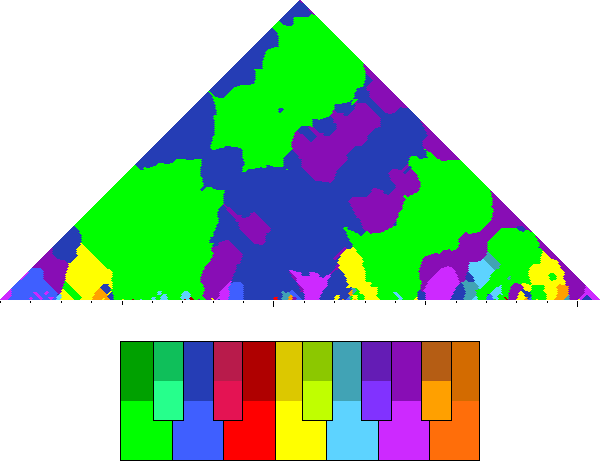
play
|
|
ID
|
Tsg12078a
|
|
Composer
|
Monteverdi, Claudio / 1592
|
|
Title
|
Ma dove, oh lasso, me! dove restaro
|
|
Final
|
(A)D
|
|
Key sig.
|
♮
|
|
Clefs
|
|
|
|
Pitchscape
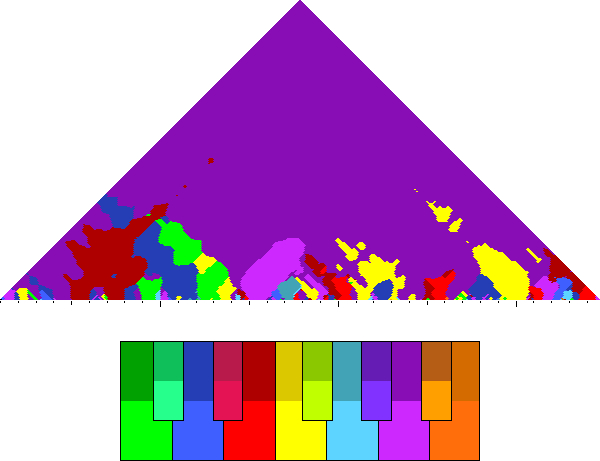
play
|
|
ID
|
Tsg12079a
|
|
Composer
|
Monteverdi, Claudio / 1592
|
|
Title
|
Io verrò là dove sete; e voi
|
|
Final
|
D
|
|
Key sig.
|
♮
|
|
Clefs
|
|
|
|
Pitchscape
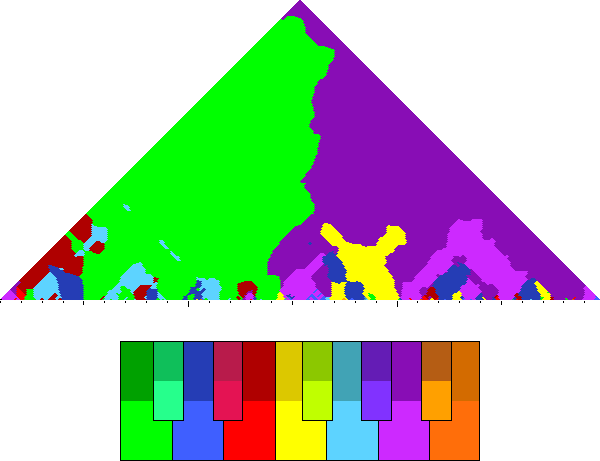
play
|
|
ID
|
Tsg14001f
|
|
Composer
|
Caprioli, Giovanni Paolo / 1602
|
|
Title
|
Usciva omai dal molle e fresco grembo
|
|
Final
|
G
|
|
Key sig.
|
♭
|
|
Clefs
|
|
|
|
Pitchscape
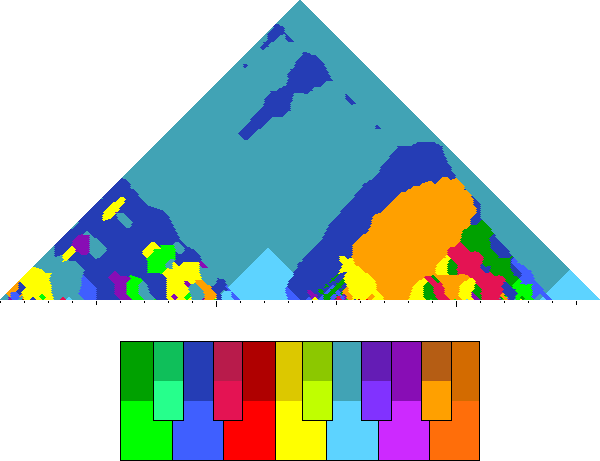
play
|
|
ID
|
Tsg14062b
|
|
Composer
|
Camarella, Giovanni Battista / 1633
|
|
Title
|
O giovinetti mentre aprile e maggio
|
|
Final
|
(G)G
|
|
Key sig.
|
♭
|
|
Clefs
|
|
|
|
Pitchscape
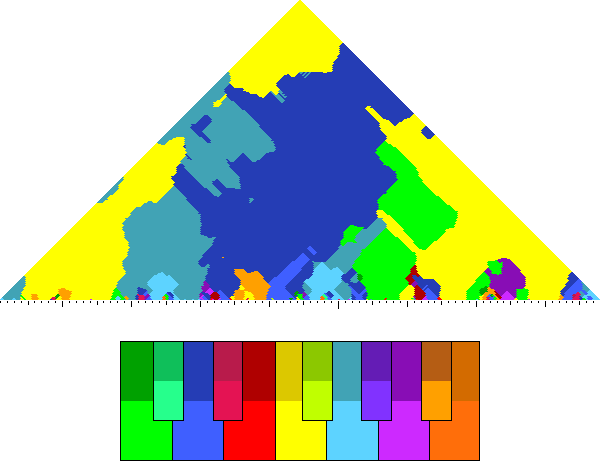
play
|
|
ID
|
Tsg16012d
|
|
Composer
|
Asola, Giammateo / 1588
|
|
Title
|
Vezzosi augelli infra le verdi fronde
|
|
Final
|
F
|
|
Key sig.
|
♭
|
|
Clefs
|
|
|
|
Pitchscape
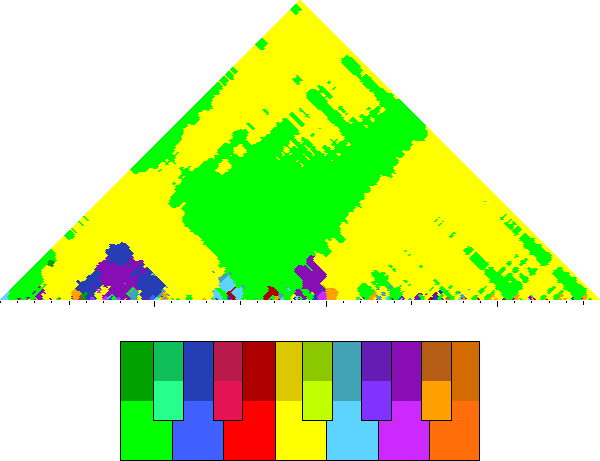
play
|
|
ID
|
Tsg16012e
|
|
Composer
|
Molinaro, Simone / 1600
|
|
Title
|
Vezzosi augelli infra le verdi fronde
|
|
Final
|
F
|
|
Key sig.
|
♭
|
|
Clefs
|
|
|
|
Pitchscape
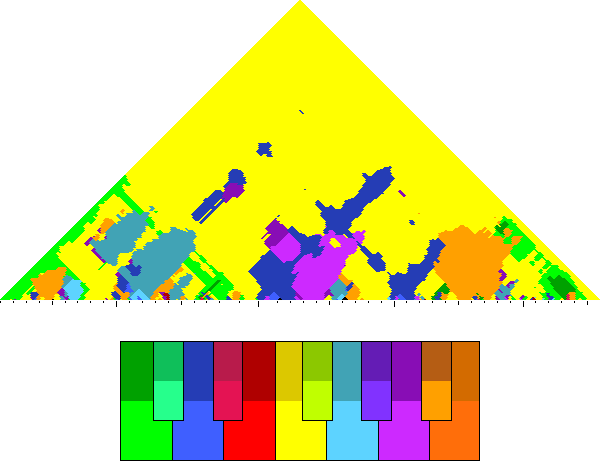
play
|
|
ID
|
Tsg16013a
|
|
Composer
|
Molinaro, Simone / 1600
|
|
Title
|
Vola fra gli altri un che le piume ha sparte
|
|
Final
|
F
|
|
Key sig.
|
♭
|
|
Clefs
|
|
|
|
Pitchscape
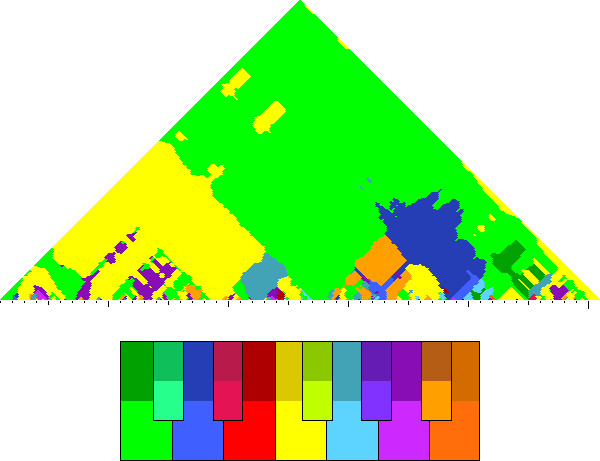
play
|
|
ID
|
Tsg16014a
|
|
Composer
|
Molinaro, Simone / 1600
|
|
Title
|
Deh mira, egli cantò, "spuntar la rosa
|
|
Final
|
F
|
|
Key sig.
|
♭
|
|
Clefs
|
|
|
|
Pitchscape
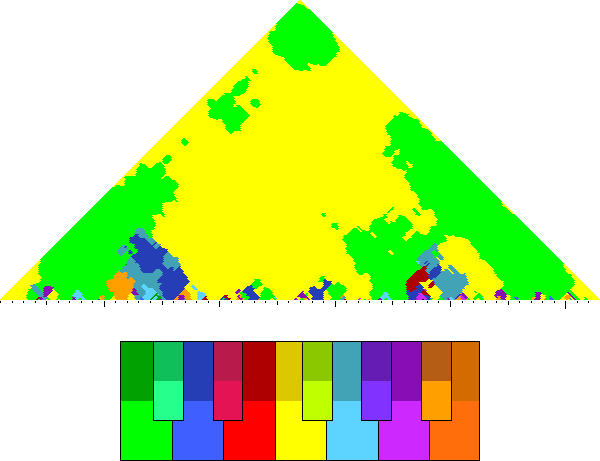
play
|
|
ID
|
Tsg16043b
|
|
Composer
|
Baccusi, Ippolito / 1594
|
|
Title
|
Qual musico gentil prima che chiara
|
|
Final
|
(A)A
|
|
Key sig.
|
♭
|
|
Clefs
|
|
|
|
Pitchscape
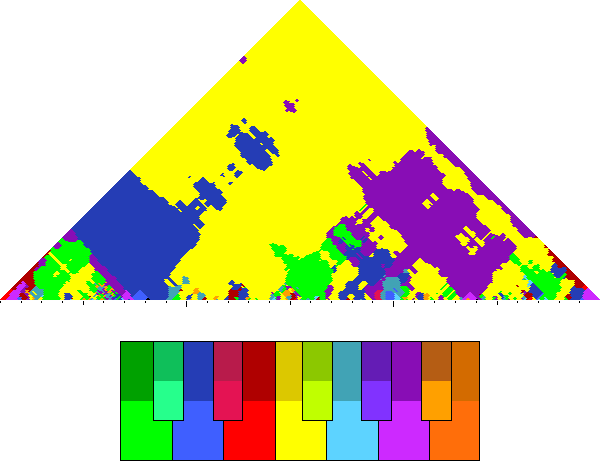
play
|
|
ID
|
Tsg16043c
|
|
Composer
|
Molinaro, Simone / 1600
|
|
Title
|
Qual musico gentil prima che chiara
|
|
Final
|
F
|
|
Key sig.
|
♭
|
|
Clefs
|
|
|
|
Pitchscape
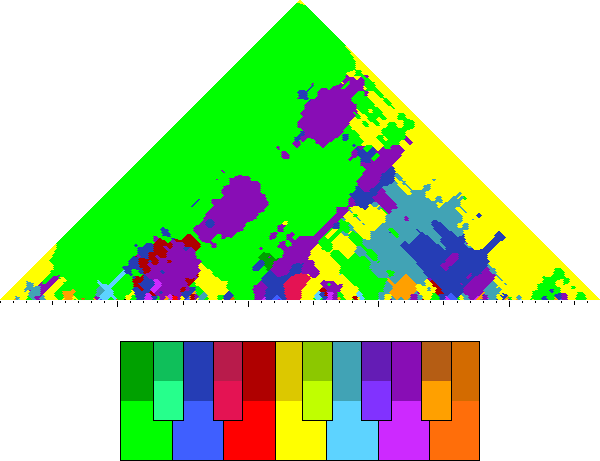
play
|
|
ID
|
Tsg16044b
|
|
Composer
|
Baccusi, Ippolito / 1594
|
|
Title
|
Poi cominciò: "Non aspettar ch'io preghi
|
|
Final
|
(D)A
|
|
Key sig.
|
♭
|
|
Clefs
|
|
|
|
Pitchscape
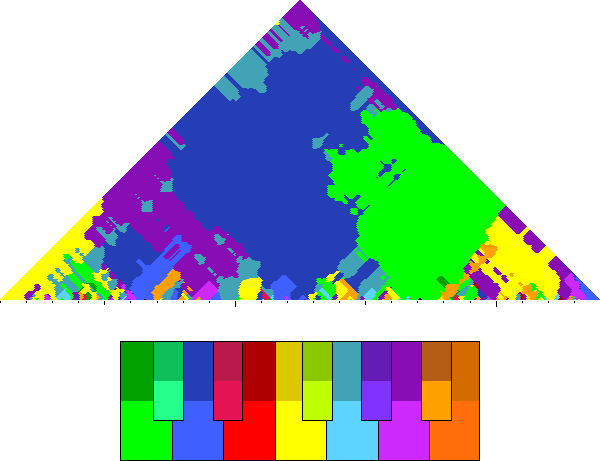
play
|
|
ID
|
Tsg16045b
|
|
Composer
|
Baccusi, Ippolito / 1594
|
|
Title
|
Se m'odii e in ciò diletto alcun tu senti
|
|
Final
|
(A)A
|
|
Key sig.
|
♭
|
|
Clefs
|
|
|
|
Pitchscape
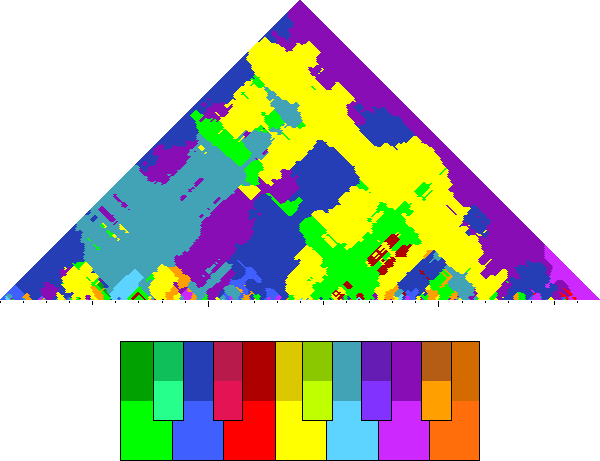
play
|
|
ID
|
Tsg16046b
|
|
Composer
|
Baccusi, Ippolito / 1594
|
|
Title
|
Aggiungi a questo ancor quel ch'a maggiore
|
|
Final
|
(D)A
|
|
Key sig.
|
♭
|
|
Clefs
|
|
|
|
Pitchscape
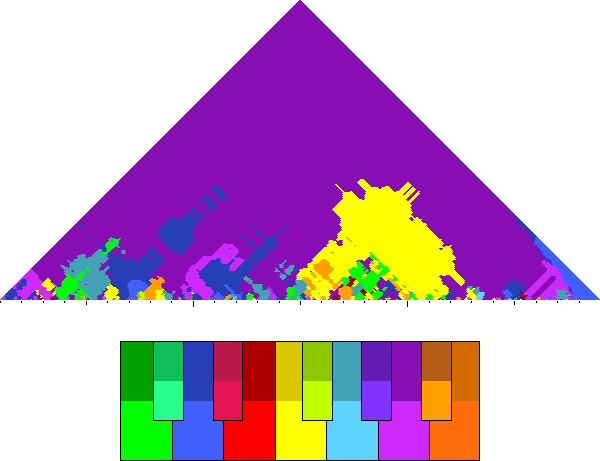
play
|
|
ID
|
Tsg16047b
|
|
Composer
|
Baccusi, Ippolito / 1594
|
|
Title
|
Sia questa pur tra le mie frodi, e vaglia
|
|
Final
|
(A)A
|
|
Key sig.
|
♭
|
|
Clefs
|
|
|
|
Pitchscape
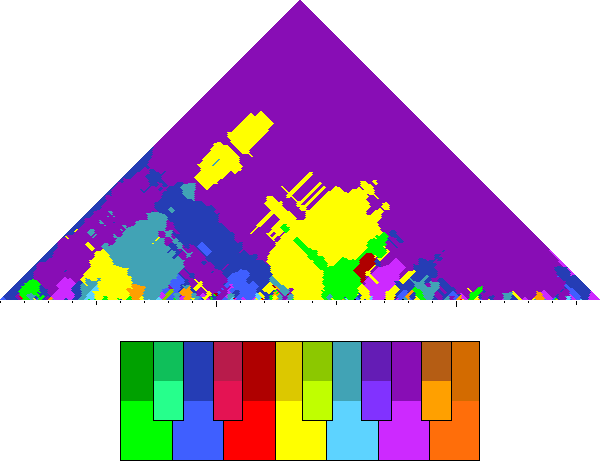
play
|
|
ID
|
Tsg16056a
|
|
Composer
|
Eredi, Francesco / 1629
|
|
Title
|
Rimanti in pace: i' vado: a te non lice
|
|
Final
|
(G)G
|
|
Key sig.
|
♭
|
|
Clefs
|
|
|
|
Pitchscape
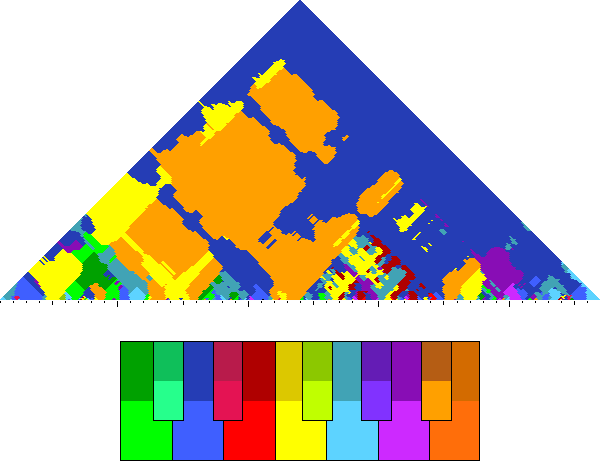
play
|
|
ID
|
Tsg16059a
|
|
Composer
|
Monteverdi, Claudio / 1592
|
|
Title
|
Vattene pur crudel con quella pace
|
|
Final
|
(A)D
|
|
Key sig.
|
♮
|
|
Clefs
|
|
|
|
Pitchscape
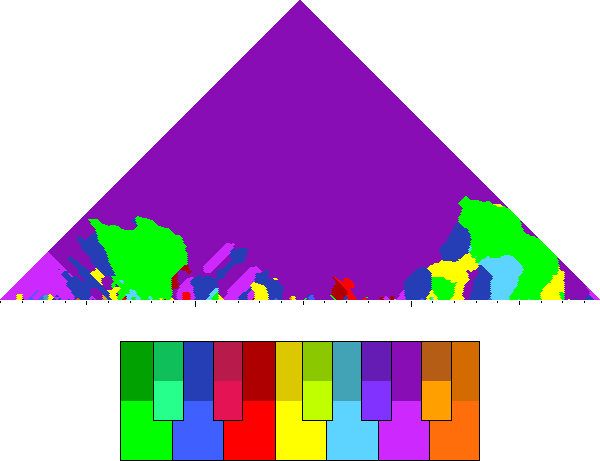
play
|
|
ID
|
Tsg16059b
|
|
Composer
|
Baccusi, Ippolito / 1594
|
|
Title
|
Vattene pur crudel con quella pace
|
|
Final
|
(A)A
|
|
Key sig.
|
♭
|
|
Clefs
|
|
|
|
Pitchscape
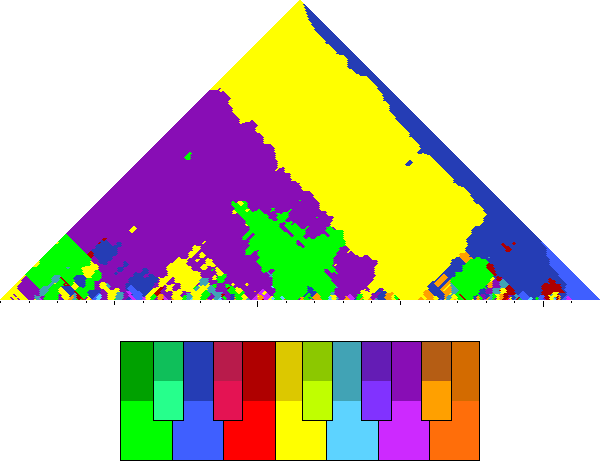
play
|
|
ID
|
Tsg16059f
|
|
Composer
|
Eredi, Francesco / 1629
|
|
Title
|
Vattene pur crudel con quella pace
|
|
Final
|
(D)G
|
|
Key sig.
|
♭
|
|
Clefs
|
|
|
|
Pitchscape
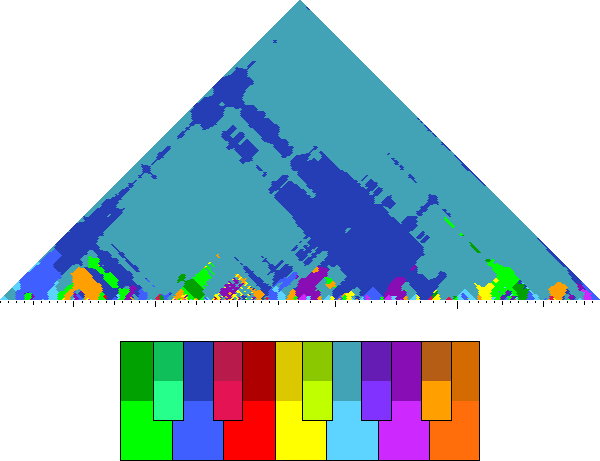
play
|
|
ID
|
Tsg16060a
|
|
Composer
|
Monteverdi, Claudio / 1592
|
|
Title
|
Là tra 'l sangue e le morti egro giacente
|
|
Final
|
(A)D
|
|
Key sig.
|
♮
|
|
Clefs
|
|
|
|
Pitchscape
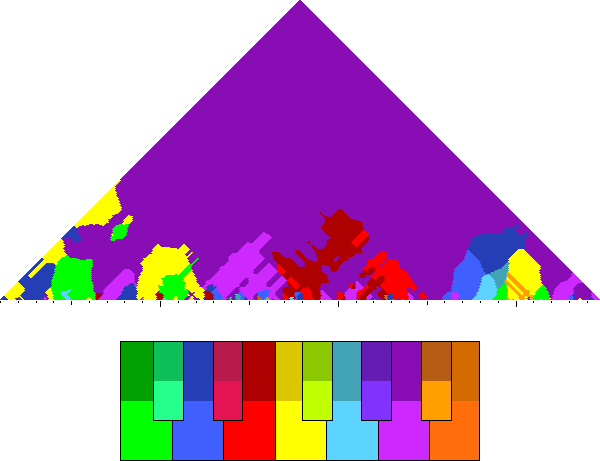
play
|
|
ID
|
Tsg16060b
|
|
Composer
|
Baccusi, Ippolito / 1594
|
|
Title
|
Là tra 'l sangue e le morti egro giacente
|
|
Final
|
(D)A
|
|
Key sig.
|
♭
|
|
Clefs
|
|
|
|
Pitchscape
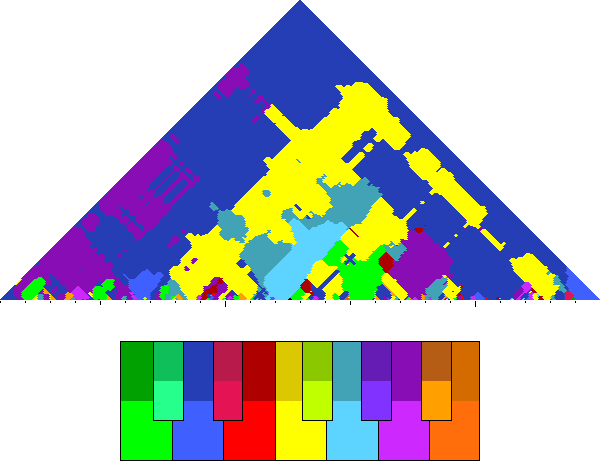
play
|
|
ID
|
Tsg16060h
|
|
Composer
|
Eredi, Francesco / 1629
|
|
Title
|
Là tra 'l sangue e le morti egro giacente
|
|
Final
|
(G)G
|
|
Key sig.
|
♭
|
|
Clefs
|
|
|
|
Pitchscape
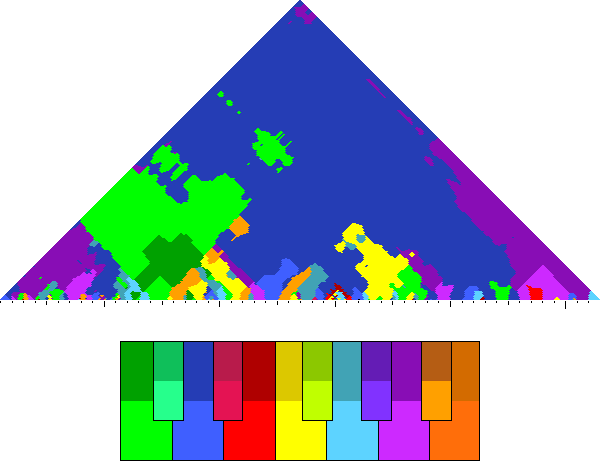
play
|
|
ID
|
Tsg16061a
|
|
Composer
|
Baccusi, Ippolito / 1594
|
|
Title
|
Chiudesti i lumi Armida: il cielo avaro
|
|
Final
|
A
|
|
Key sig.
|
♭
|
|
Clefs
|
|
|
|
Pitchscape
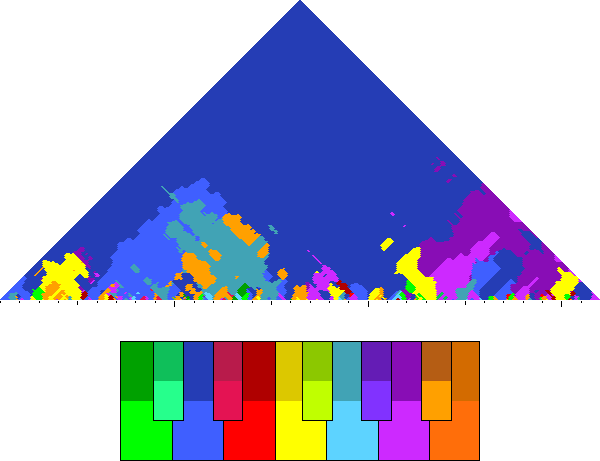
play
|
|
ID
|
Tsg16061f
|
|
Composer
|
Eredi, Francesco / 1629
|
|
Title
|
Chiudesti i lumi Armida: il cielo avaro
|
|
Final
|
(G)G
|
|
Key sig.
|
♭
|
|
Clefs
|
|
|
|
Pitchscape
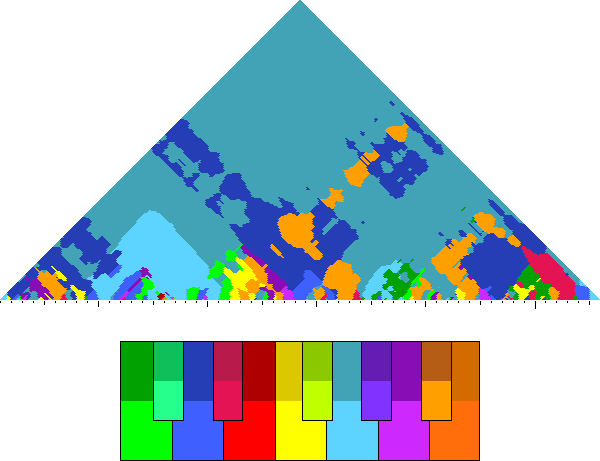
play
|
|
ID
|
Tsg16062a
|
|
Composer
|
Eredi, Francesco / 1629
|
|
Title
|
Or che farà? Dee su l'ignuda arena
|
|
Final
|
(G)G
|
|
Key sig.
|
♭
|
|
Clefs
|
|
|
|
Pitchscape
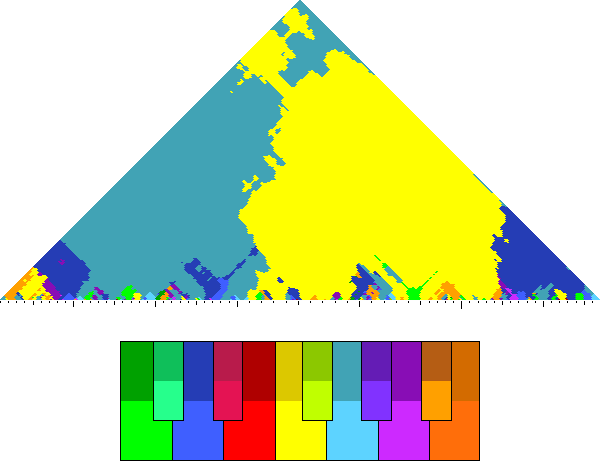
play
|
|
ID
|
Tsg16063a
|
|
Composer
|
Monteverdi, Claudio / 1592
|
|
Title
|
Poi ch'ella in sé tornò, deserto e muto
|
|
Final
|
D
|
|
Key sig.
|
♮
|
|
Clefs
|
|
|
|
Pitchscape
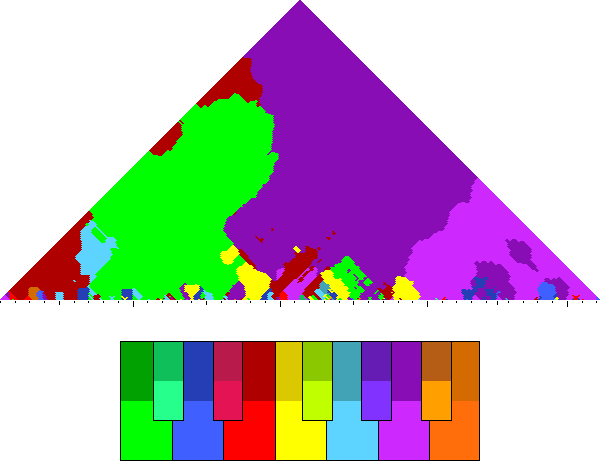
play
|
|
ID
|
Tsg16063c
|
|
Composer
|
Eredi, Francesco / 1629
|
|
Title
|
Poi ch'ella in sé tornò, deserto e muto
|
|
Final
|
(G)G
|
|
Key sig.
|
♭
|
|
Clefs
|
|
|
|
Pitchscape
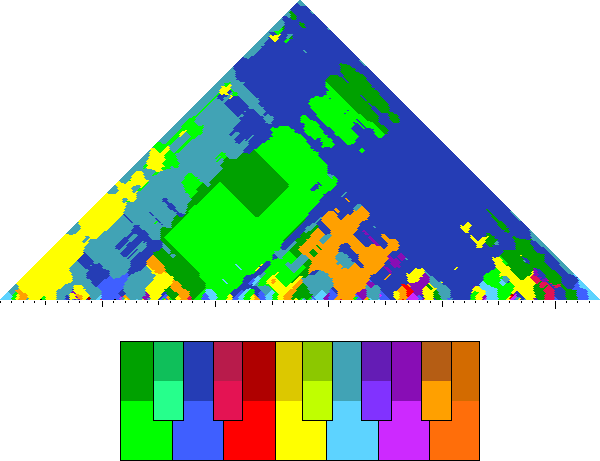
play
|
|
ID
|
Tsg16064a
|
|
Composer
|
Eredi, Francesco / 1629
|
|
Title
|
Che fa più meco il pianto? Altr'arme, altr'arte
|
|
Final
|
(D)G
|
|
Key sig.
|
♭
|
|
Clefs
|
|
|
|
Pitchscape
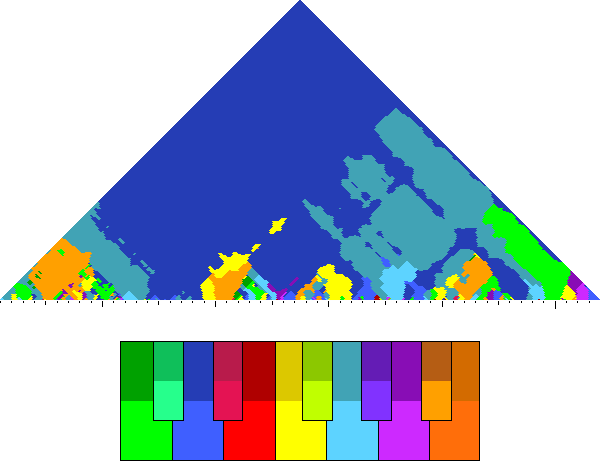
play
|
|
ID
|
Tsg16065b
|
|
Composer
|
Eredi, Francesco / 1629
|
|
Title
|
Misera Armida, allor dovevi e degno
|
|
Final
|
(G)G
|
|
Key sig.
|
♭
|
|
Clefs
|
|
|
|
Pitchscape
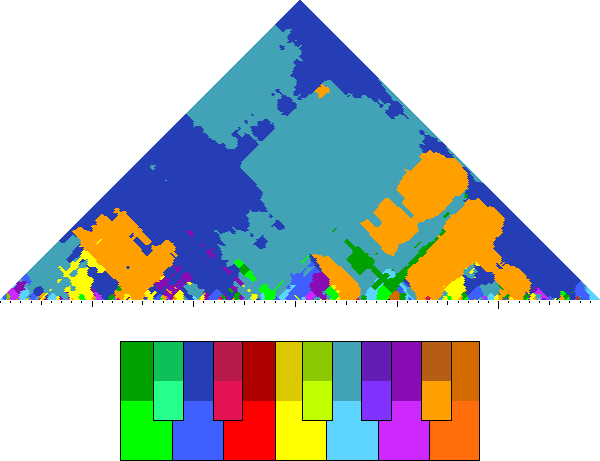
play
|
|
ID
|
Tsg16066a
|
|
Composer
|
Eredi, Francesco / 1629
|
|
Title
|
Questa bellezza mia sarà mercede
|
|
Final
|
G
|
|
Key sig.
|
♭
|
|
Clefs
|
|
|
|
Pitchscape
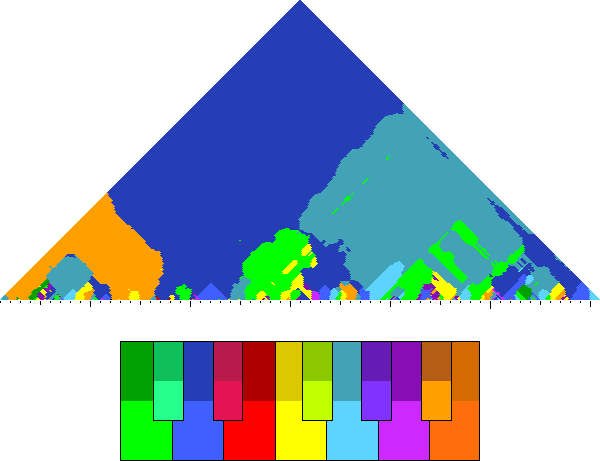
play
|
|
ID
|
Tsg19106b
|
|
Composer
|
Baccusi, Ippolito / 1594
|
|
Title
|
Misera non credea ch'a gli occhi miei
|
|
Final
|
(E)A
|
|
Key sig.
|
♮
|
|
Clefs
|
|
|
|
Pitchscape
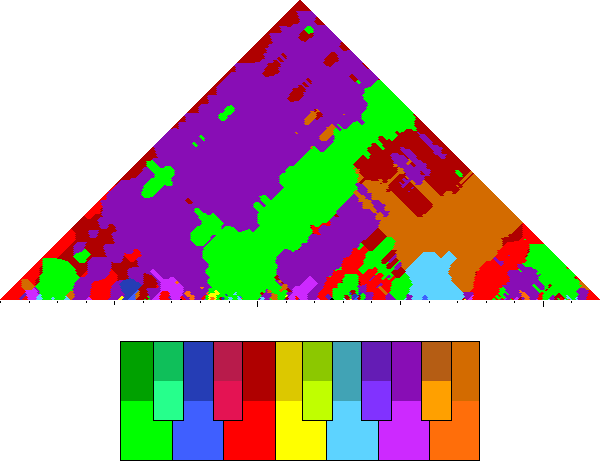
play
|
|
ID
|
Tsg19107b
|
|
Composer
|
Baccusi, Ippolito / 1594
|
|
Title
|
Ma che? squallido e scuro anco mi piaci
|
|
Final
|
A
|
|
Key sig.
|
♮
|
|
Clefs
|
|
|
|
Pitchscape
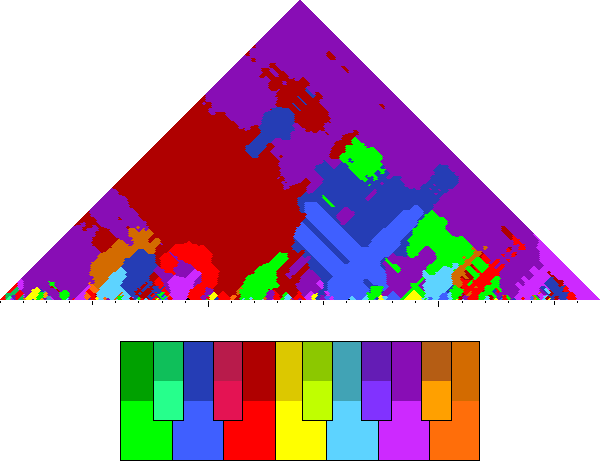
play
|
|
ID
|
Tsg20123a
|
|
Composer
|
Eredi, Francesco / 1629
|
|
Title
|
Piacquele assai che 'n quelle valli ombrose
|
|
Final
|
(G)G
|
|
Key sig.
|
♮
|
|
Clefs
|
|
|
|
Pitchscape
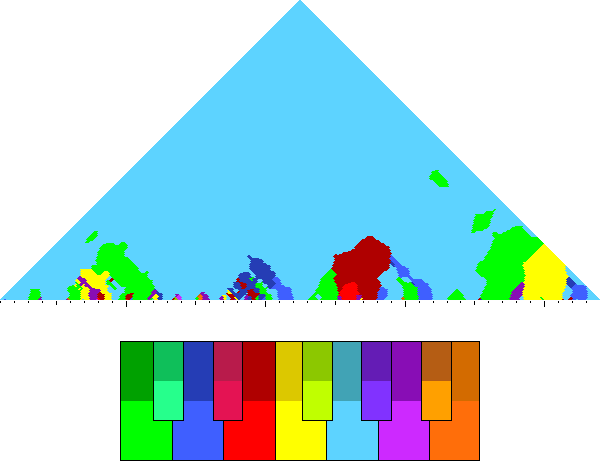
play
|
|
ID
|
Tsg20124a
|
|
Composer
|
Eredi, Francesco / 1629
|
|
Title
|
Ah, ma non fia che fra tant'armi e tante
|
|
Final
|
(G)G
|
|
Key sig.
|
♮
|
|
Clefs
|
|
|
|
Pitchscape
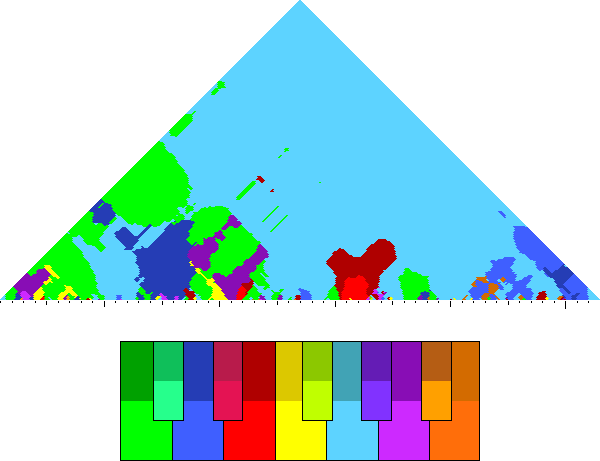
play
|
|
ID
|
Tsg20125a
|
|
Composer
|
Eredi, Francesco / 1629
|
|
Title
|
Dimostratevi in me, ch'io vi perdono
|
|
Final
|
(G)G
|
|
Key sig.
|
♮
|
|
Clefs
|
|
|
|
Pitchscape
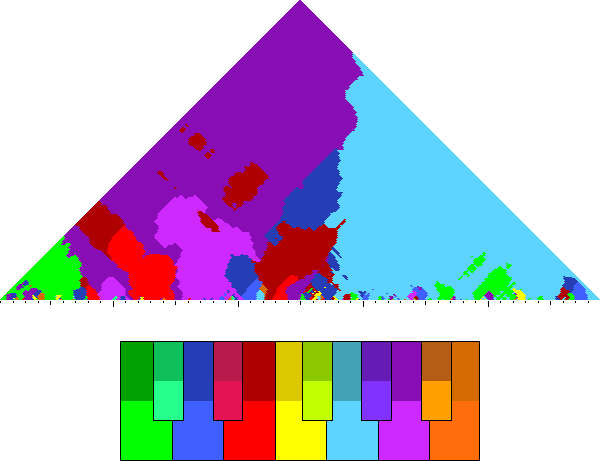
play
|
|
ID
|
Tsg20126a
|
|
Composer
|
Eredi, Francesco / 1629
|
|
Title
|
Felice me se nel morir non reco
|
|
Final
|
(G)G
|
|
Key sig.
|
♮
|
|
Clefs
|
|
|
|
Pitchscape
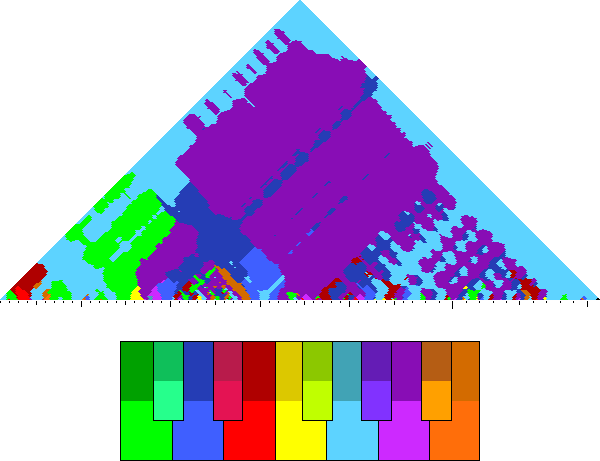
play
|
|
ID
|
Tsg20127a
|
|
Composer
|
Eredi, Francesco / 1629
|
|
Title
|
Qui tacque: e stabilito il suo pensiero
|
|
Final
|
(D)G
|
|
Key sig.
|
♮
|
|
Clefs
|
|
|
|
Pitchscape
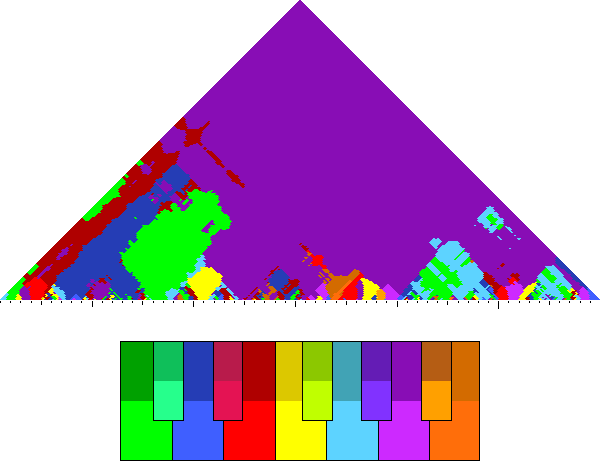
play
|
|
ID
|
Tsg20128b
|
|
Composer
|
Eredi, Francesco / 1629
|
|
Title
|
Si volse Armida e 'l rimirò improvviso
|
|
Final
|
(G)G
|
|
Key sig.
|
♮
|
|
Clefs
|
|
|
|
Pitchscape
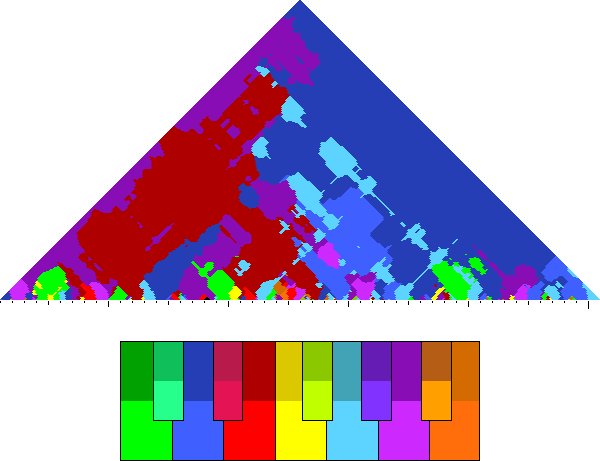
play
|
|
ID
|
Tsg20129a
|
|
Composer
|
Eredi, Francesco / 1629
|
|
Title
|
E 'l bel volto e 'l bel seno a la meschina
|
|
Final
|
(D)G
|
|
Key sig.
|
♮
|
|
Clefs
|
|
|
|
Pitchscape
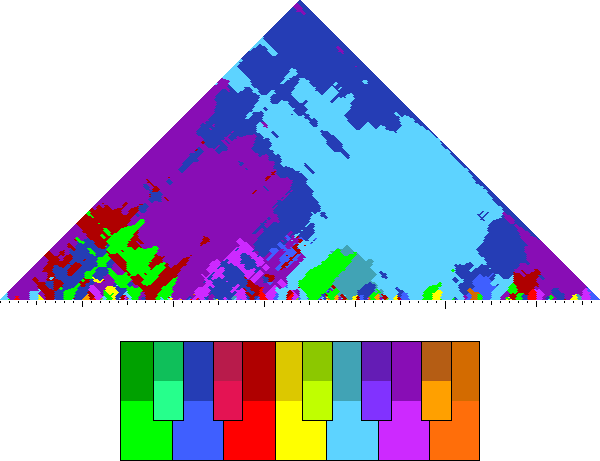
play
|
|
ID
|
Tsg20130a
|
|
Composer
|
Eredi, Francesco / 1629
|
|
Title
|
E con man languidetta il forte braccio
|
|
Final
|
(G)G
|
|
Key sig.
|
♮
|
|
Clefs
|
|
|
|
Pitchscape
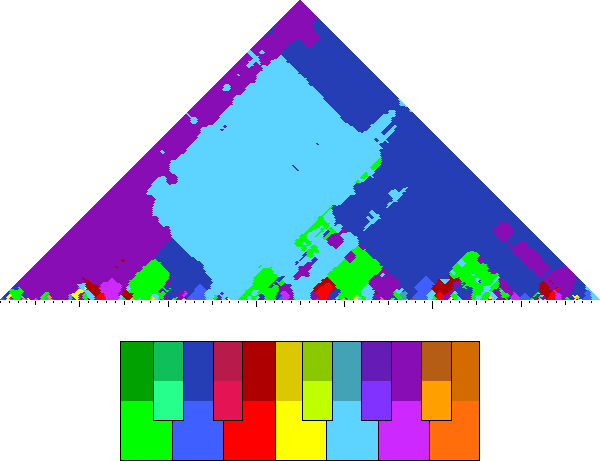
play
|
|
ID
|
Tsg20131b
|
|
Composer
|
Eredi, Francesco / 1629
|
|
Title
|
O sempre, e quando parti e quando torni
|
|
Final
|
(D)G
|
|
Key sig.
|
♮
|
|
Clefs
|
|
|
|
Pitchscape
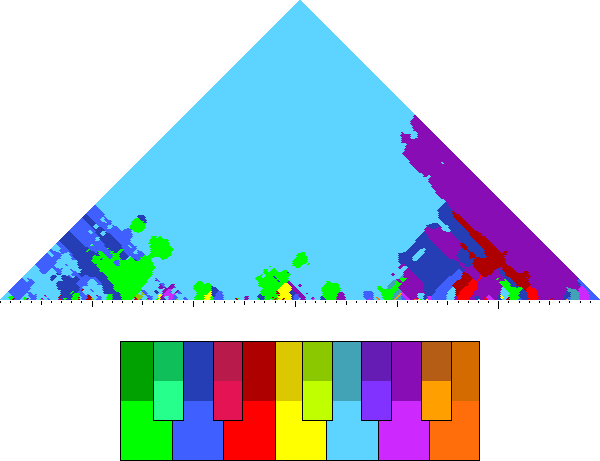
play
|
|
ID
|
Tsg20134a
|
|
Composer
|
Eredi, Francesco / 1629
|
|
Title
|
Così doleasi e con le flebil onde
|
|
Final
|
G
|
|
Key sig.
|
♮
|
|
Clefs
|
|
|
|
Pitchscape
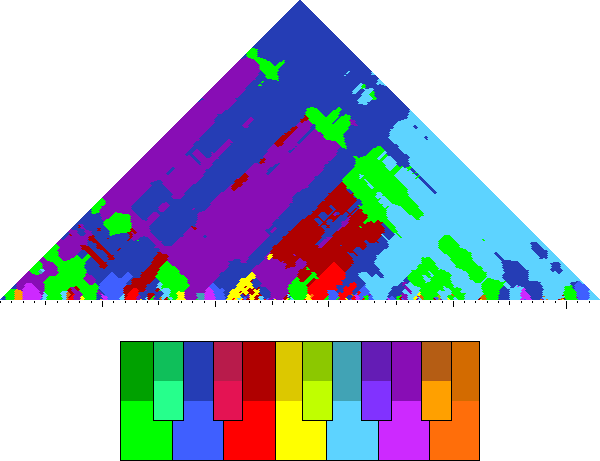
play
|


